
 Yahoo Finance
 Waters (WAT) Q2 Earnings Surpass Estimates, Revenues Miss
Waters Corporation WAT delivered second-quarter 2019 non-GAAP earnings of $2.14 per share, beating the Zacks Consensus Estimate by 3 cents. The figure improved 10% on a year-over-year basis and 33.7% sequentially.
Net sales came in $599.2 million, up 0.5% from the year-ago quarter and 16.6% from the previous quarter. This was driven by strengthening momentum across the United States and China. Further, improved performance in the pharmaceutical market contributed to the results.
However, the figure lagged the Zacks Consensus Estimate of $602.2 million.
The company suffered from adverse effects of foreign exchange fluctuations, which had an impact of 2% on the top line. Further, weak performance in the industrial, academic and governmental market weighed on the results.
Nevertheless, the company remains optimistic about its strengthening growth initiatives and new product introductions which are likely to aid it in gaining investors’ confidence in the near term.
Top Line in Detail
Waters’ net sales figure can be categorized in four ways:
By Operating Segment: The company operates in two organized segments — Waters and TA.
Waters segment (88.6% of net sales) generated $531.12 million of sales, up 1% from the year-ago quarter. Sales in TA segment came in $68.04 million and accounted for 11.4% of the net sales. The figure reflected year-over-year decline of 1%.
By Products & Services: This division comprises three segments — Instruments, Services and Chemistry.
Instruments sales (47.9% of sales) came in $286.97 million, down 1% on a year-over-year basis.
Service sales (35.4% of the sales) were $211.89 million, improving 2.2% year over year.
Chemistry sales (16.7% of the sales) were $100.29 million, advancing 1.2% from the year-ago quarter.
Moreover, service and chemistry sections together generated recurring revenues of $312.19 million, up 2% from the year-ago quarter.
By Markets: The company serves three end markets — Pharmaceutical, Industrial and Governmental & Academic.
Pharmaceutical market (58.4% of net sales) generated sales of $350.14 million, up 3.5% on a year-over-year basis.
Industrial market (29.4% of sales) sales came in $176.11 million, down 4% from the year-ago quarter.
Governmental & Academic (12.2% of sales) generated $72.91 million of sales. The figure decreased 1.7% year over year.
By Geography: This company’s operating regions include Asia, Americas and Europe.
Asia (39.9% of net sales) generated $238.83 million of sales, up 1% on a year-over-year basis.
Americas (34.5% of sales) generated $206.77 million of sales, improving 4.4% year over year.
Europe (25.6% of sales) generated $153.55 million of sales, down 4.7% from prior-year quarter.
Waters Corporation Price, Consensus and EPS Surprise
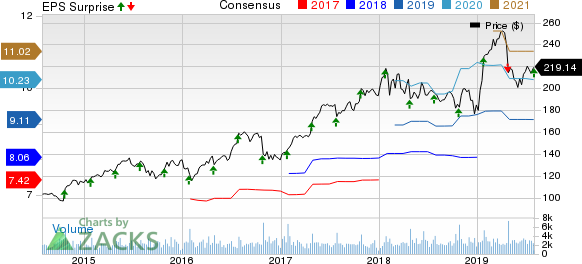
Waters Corporation price-consensus-eps-surprise-chart | Waters Corporation Quote
Operating Details
In the second quarter, non-GAAP selling and administrative expenses were $130.5 million, suggesting a decline of 3.7% from the year-ago quarter.
Per the company, research and development spending was $36.5 million, indicating an increase of 2.4% form the year-ago reported figure.
Adjusted operating margin was 30.5%, which remained flat year over year.
Balance Sheet & Cash Flow
As of Mar 30, 2019, cash, cash equivalents and investments came in $675.8 million, lower than $1.17 billion as of Mar 30, 2019.
Further, total liabilities were $2.27 billion, down from $2.28 billion in the previous quarter.
Waters also generated free cash flow of $136.4 million in the second quarter.
Guidance
For third-quarter 2019, Waters expects non-GAAP earnings in the range of $2.05-$2.15 per share. The Zacks Consensus Estimate for earnings is pegged at $2.25.
The company anticipates net sales growth between 2% and 4% on a constant currency basis. The Zacks Consensus Estimate for sales is currently projected at $601.9 million.
For 2019, Waters lowered guided range for non-GAAP earnings from $$9.05-$9.25 per share to $8.95-$9.10 per share. The Zacks Consensus Estimate for 2019 earnings is pegged at $9.11 per share.
Further, the company guided net sales growth in the band of 1-3% on a constant currency basis, lower than the previously anticipated range of 2-4%. The Zacks Consensus Estimate for sales is pegged at $2.46 billion.
Zacks Rank & Key Picks
Waters currently has a Zacks Rank #3 (Hold). You can see the complete list of today’s Zacks #1 Rank (Strong Buy) stocks here.
Some better-ranked stocks in the broader technology sector are Rosetta Stone RST, Alteryx AYX and Asure Software ASUR. While Rosetta Stone and Alteryx sport a Zacks Rank #1, Asure Software carries a Zacks Rank #2 (Buy).
Long-term earnings growth rate for Rosetta Stone, Alteryx and Asure Software is currently projected to be 12.5%, 13.7% and 23.67%, respectively.
Today's Best Stocks from Zacks
Would you like to see the updated picks from our best market-beating strategies? From 2017 through 2018, while the S&P 500 gained +15.8%, five of our screens returned +38.0%, +61.3%, +61.6%, +68.1%, and +98.3%.
This outperformance has not just been a recent phenomenon. From 2000 – 2018, while the S&P averaged +4.8% per year, our top strategies averaged up to +56.2% per year.
See their latest picks free >>
Want the latest recommendations from Zacks Investment Research? Today, you can download 7 Best Stocks for the Next 30 Days. Click to get this free report
Asure Software Inc (ASUR) : Free Stock Analysis Report
Rosetta Stone (RST) : Free Stock Analysis Report
Waters Corporation (WAT) : Free Stock Analysis Report
Alteryx, Inc. (AYX) : Free Stock Analysis Report
To read this article on Zacks.com click here.
Zacks Investment Research
