
 Yahoo Finance
 A Rising Share Price Has Us Looking Closely At Stamps.com Inc.'s (NASDAQ:STMP) P/E Ratio

Stamps.com (NASDAQ:STMP) shares have continued recent momentum with a 30% gain in the last month alone. Looking back a bit further, we're also happy to report the stock is up 81% in the last year.
Assuming no other changes, a sharply higher share price makes a stock less attractive to potential buyers. While the market sentiment towards a stock is very changeable, in the long run, the share price will tend to move in the same direction as earnings per share. The implication here is that deep value investors might steer clear when expectations of a company are too high. One way to gauge market expectations of a stock is to look at its Price to Earnings Ratio (PE Ratio). A high P/E ratio means that investors have a high expectation about future growth, while a low P/E ratio means they have low expectations about future growth.
See our latest analysis for Stamps.com
How Does Stamps.com's P/E Ratio Compare To Its Peers?
Stamps.com's P/E of 41.98 indicates some degree of optimism towards the stock. You can see in the image below that the average P/E (22.5) for companies in the online retail industry is lower than Stamps.com's P/E.
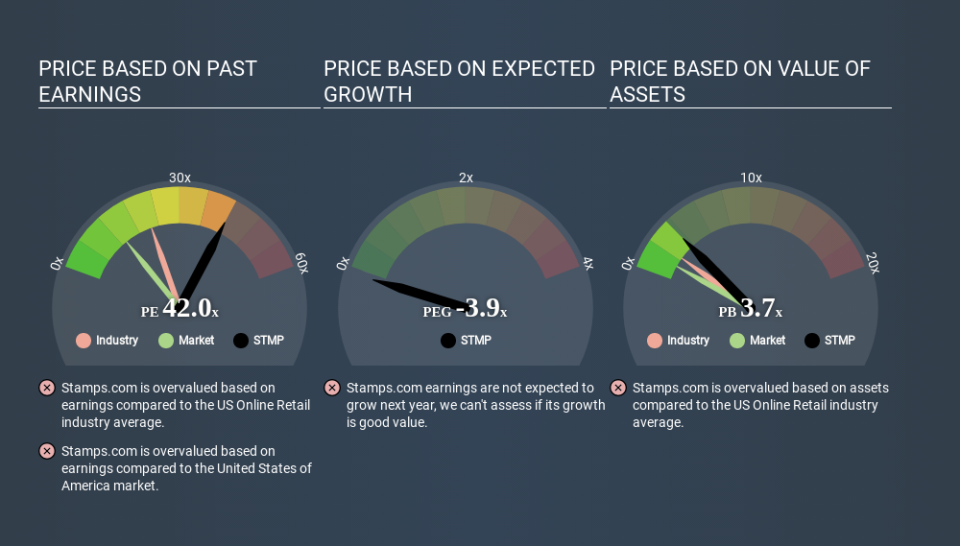
That means that the market expects Stamps.com will outperform other companies in its industry. Shareholders are clearly optimistic, but the future is always uncertain. So investors should delve deeper. I like to check if company insiders have been buying or selling.
How Growth Rates Impact P/E Ratios
When earnings fall, the 'E' decreases, over time. That means even if the current P/E is low, it will increase over time if the share price stays flat. So while a stock may look cheap based on past earnings, it could be expensive based on future earnings.
Stamps.com's earnings per share fell by 63% in the last twelve months. But over the longer term (5 years) earnings per share have increased by 8.3%. And over the longer term (3 years) earnings per share have decreased 7.7% annually. This could justify a low P/E.
A Limitation: P/E Ratios Ignore Debt and Cash In The Bank
Don't forget that the P/E ratio considers market capitalization. That means it doesn't take debt or cash into account. Theoretically, a business can improve its earnings (and produce a lower P/E in the future) by investing in growth. That means taking on debt (or spending its cash).
Such spending might be good or bad, overall, but the key point here is that you need to look at debt to understand the P/E ratio in context.
How Does Stamps.com's Debt Impact Its P/E Ratio?
Since Stamps.com holds net cash of US$105m, it can spend on growth, justifying a higher P/E ratio than otherwise.
The Verdict On Stamps.com's P/E Ratio
Stamps.com trades on a P/E ratio of 42.0, which is multiples above its market average of 13.2. The recent drop in earnings per share might keep value investors away, but the healthy balance sheet means the company retains the potential for future growth. If this growth fails to materialise, the current high P/E could prove to be temporary, as the share price falls. What is very clear is that the market has become significantly more optimistic about Stamps.com over the last month, with the P/E ratio rising from 32.3 back then to 42.0 today. If you like to buy stocks that have recently impressed the market, then this one might be a candidate; but if you prefer to invest when there is 'blood in the streets', then you may feel the opportunity has passed.
Investors should be looking to buy stocks that the market is wrong about. If the reality for a company is better than it expects, you can make money by buying and holding for the long term. So this free visual report on analyst forecasts could hold the key to an excellent investment decision.
Of course you might be able to find a better stock than Stamps.com. So you may wish to see this free collection of other companies that have grown earnings strongly.
If you spot an error that warrants correction, please contact the editor at editorial-team@simplywallst.com. This article by Simply Wall St is general in nature. It does not constitute a recommendation to buy or sell any stock, and does not take account of your objectives, or your financial situation. Simply Wall St has no position in the stocks mentioned.
We aim to bring you long-term focused research analysis driven by fundamental data. Note that our analysis may not factor in the latest price-sensitive company announcements or qualitative material. Thank you for reading.
