
 Yahoo Finance
 Returns On Capital At Johnson Controls International (NYSE:JCI) Have Stalled
If you're looking for a multi-bagger, there's a few things to keep an eye out for. Amongst other things, we'll want to see two things; firstly, a growing return on capital employed (ROCE) and secondly, an expansion in the company's amount of capital employed. This shows us that it's a compounding machine, able to continually reinvest its earnings back into the business and generate higher returns. Although, when we looked at Johnson Controls International (NYSE:JCI), it didn't seem to tick all of these boxes.
Return On Capital Employed (ROCE): What Is It?
Just to clarify if you're unsure, ROCE is a metric for evaluating how much pre-tax income (in percentage terms) a company earns on the capital invested in its business. Analysts use this formula to calculate it for Johnson Controls International:
Return on Capital Employed = Earnings Before Interest and Tax (EBIT) ÷ (Total Assets - Current Liabilities)
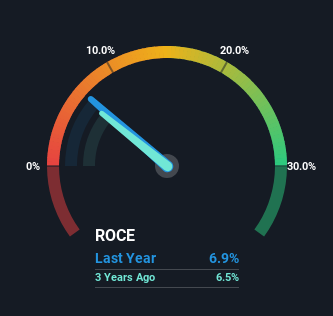
0.069 = US$2.1b ÷ (US$43b - US$14b) (Based on the trailing twelve months to March 2024).
Therefore, Johnson Controls International has an ROCE of 6.9%. In absolute terms, that's a low return and it also under-performs the Building industry average of 17%.
View our latest analysis for Johnson Controls International
In the above chart we have measured Johnson Controls International's prior ROCE against its prior performance, but the future is arguably more important. If you'd like to see what analysts are forecasting going forward, you should check out our free analyst report for Johnson Controls International .
What Can We Tell From Johnson Controls International's ROCE Trend?
Over the past five years, Johnson Controls International's ROCE and capital employed have both remained mostly flat. It's not uncommon to see this when looking at a mature and stable business that isn't re-investing its earnings because it has likely passed that phase of the business cycle. So don't be surprised if Johnson Controls International doesn't end up being a multi-bagger in a few years time. With fewer investment opportunities, it makes sense that Johnson Controls International has been paying out a decent 35% of its earnings to shareholders. Unless businesses have highly compelling growth opportunities, they'll typically return some money to shareholders.
The Bottom Line On Johnson Controls International's ROCE
We can conclude that in regards to Johnson Controls International's returns on capital employed and the trends, there isn't much change to report on. Investors must think there's better things to come because the stock has knocked it out of the park, delivering a 113% gain to shareholders who have held over the last five years. However, unless these underlying trends turn more positive, we wouldn't get our hopes up too high.
Johnson Controls International does come with some risks though, we found 3 warning signs in our investment analysis, and 1 of those makes us a bit uncomfortable...
While Johnson Controls International isn't earning the highest return, check out this free list of companies that are earning high returns on equity with solid balance sheets.
Have feedback on this article? Concerned about the content? Get in touch with us directly. Alternatively, email editorial-team (at) simplywallst.com.
This article by Simply Wall St is general in nature. We provide commentary based on historical data and analyst forecasts only using an unbiased methodology and our articles are not intended to be financial advice. It does not constitute a recommendation to buy or sell any stock, and does not take account of your objectives, or your financial situation. We aim to bring you long-term focused analysis driven by fundamental data. Note that our analysis may not factor in the latest price-sensitive company announcements or qualitative material. Simply Wall St has no position in any stocks mentioned.
