
 Yahoo Finance
 Primech Holdings Ltd.'s (NASDAQ:PMEC) Price In Tune With Revenues
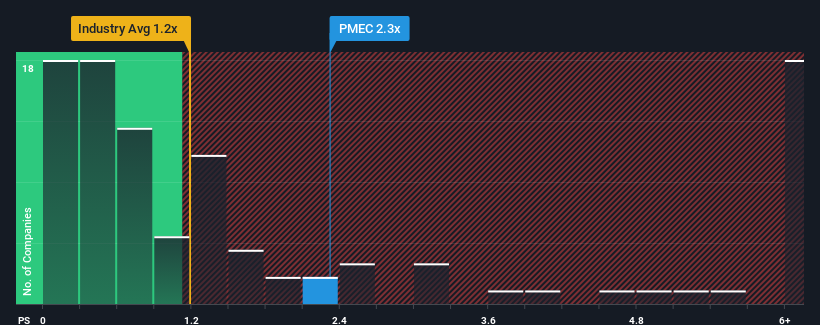
When you see that almost half of the companies in the Commercial Services industry in the United States have price-to-sales ratios (or "P/S") below 1.2x, Primech Holdings Ltd. (NASDAQ:PMEC) looks to be giving off some sell signals with its 2.3x P/S ratio. Nonetheless, we'd need to dig a little deeper to determine if there is a rational basis for the elevated P/S.
See our latest analysis for Primech Holdings
What Does Primech Holdings' Recent Performance Look Like?
The revenue growth achieved at Primech Holdings over the last year would be more than acceptable for most companies. Perhaps the market is expecting this decent revenue performance to beat out the industry over the near term, which has kept the P/S propped up. If not, then existing shareholders may be a little nervous about the viability of the share price.
We don't have analyst forecasts, but you can see how recent trends are setting up the company for the future by checking out our free report on Primech Holdings' earnings, revenue and cash flow.
How Is Primech Holdings' Revenue Growth Trending?
Primech Holdings' P/S ratio would be typical for a company that's expected to deliver solid growth, and importantly, perform better than the industry.
Retrospectively, the last year delivered an exceptional 27% gain to the company's top line. Pleasingly, revenue has also lifted 44% in aggregate from three years ago, thanks to the last 12 months of growth. Therefore, it's fair to say the revenue growth recently has been superb for the company.
Comparing that recent medium-term revenue trajectory with the industry's one-year growth forecast of 10% shows it's noticeably more attractive.
In light of this, it's understandable that Primech Holdings' P/S sits above the majority of other companies. Presumably shareholders aren't keen to offload something they believe will continue to outmanoeuvre the wider industry.
The Key Takeaway
While the price-to-sales ratio shouldn't be the defining factor in whether you buy a stock or not, it's quite a capable barometer of revenue expectations.
We've established that Primech Holdings maintains its high P/S on the strength of its recent three-year growth being higher than the wider industry forecast, as expected. In the eyes of shareholders, the probability of a continued growth trajectory is great enough to prevent the P/S from pulling back. If recent medium-term revenue trends continue, it's hard to see the share price falling strongly in the near future under these circumstances.
Having said that, be aware Primech Holdings is showing 2 warning signs in our investment analysis, you should know about.
If you're unsure about the strength of Primech Holdings' business, why not explore our interactive list of stocks with solid business fundamentals for some other companies you may have missed.
Have feedback on this article? Concerned about the content? Get in touch with us directly. Alternatively, email editorial-team (at) simplywallst.com.
This article by Simply Wall St is general in nature. We provide commentary based on historical data and analyst forecasts only using an unbiased methodology and our articles are not intended to be financial advice. It does not constitute a recommendation to buy or sell any stock, and does not take account of your objectives, or your financial situation. We aim to bring you long-term focused analysis driven by fundamental data. Note that our analysis may not factor in the latest price-sensitive company announcements or qualitative material. Simply Wall St has no position in any stocks mentioned.
