
 Yahoo Finance
 Precigen (NASDAQ:PGEN) shareholders are up 15% this past week, but still in the red over the last three years
Precigen, Inc. (NASDAQ:PGEN) shareholders should be happy to see the share price up 15% in the last week. But only the myopic could ignore the astounding decline over three years. Indeed, the share price is down a whopping 78% in the last three years. So it sure is nice to see a bit of an improvement. Of course the real question is whether the business can sustain a turnaround.
The recent uptick of 15% could be a positive sign of things to come, so let's take a look at historical fundamentals.
See our latest analysis for Precigen
Precigen wasn't profitable in the last twelve months, it is unlikely we'll see a strong correlation between its share price and its earnings per share (EPS). Arguably revenue is our next best option. Generally speaking, companies without profits are expected to grow revenue every year, and at a good clip. As you can imagine, fast revenue growth, when maintained, often leads to fast profit growth.
In the last three years Precigen saw its revenue shrink by 61% per year. That means its revenue trend is very weak compared to other loss making companies. The swift share price decline at an annual compound rate of 21%, reflects this weak fundamental performance. Never forget that loss making companies with falling revenue can and do cause losses for everyday investors. There is a good reason that investors often describe buying a sharply falling stock price as 'trying to catch a falling knife'. Think about it.
The graphic below depicts how earnings and revenue have changed over time (unveil the exact values by clicking on the image).
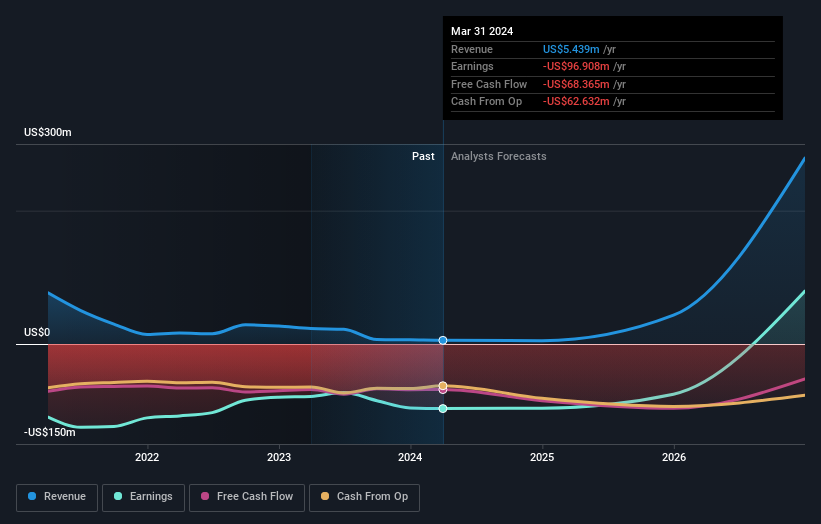
We like that insiders have been buying shares in the last twelve months. Having said that, most people consider earnings and revenue growth trends to be a more meaningful guide to the business. This free report showing analyst forecasts should help you form a view on Precigen
A Different Perspective
Precigen shareholders are up 16% for the year. Unfortunately this falls short of the market return. On the bright side, that's still a gain, and it is certainly better than the yearly loss of about 11% endured over half a decade. It could well be that the business is stabilizing. I find it very interesting to look at share price over the long term as a proxy for business performance. But to truly gain insight, we need to consider other information, too. Consider for instance, the ever-present spectre of investment risk. We've identified 1 warning sign with Precigen , and understanding them should be part of your investment process.
Precigen is not the only stock that insiders are buying. For those who like to find lesser know companies this free list of growing companies with recent insider purchasing, could be just the ticket.
Please note, the market returns quoted in this article reflect the market weighted average returns of stocks that currently trade on American exchanges.
Have feedback on this article? Concerned about the content? Get in touch with us directly. Alternatively, email editorial-team (at) simplywallst.com.
This article by Simply Wall St is general in nature. We provide commentary based on historical data and analyst forecasts only using an unbiased methodology and our articles are not intended to be financial advice. It does not constitute a recommendation to buy or sell any stock, and does not take account of your objectives, or your financial situation. We aim to bring you long-term focused analysis driven by fundamental data. Note that our analysis may not factor in the latest price-sensitive company announcements or qualitative material. Simply Wall St has no position in any stocks mentioned.
