
 Yahoo Finance
 Movado Group (NYSE:MOV) Could Be Struggling To Allocate Capital
When researching a stock for investment, what can tell us that the company is in decline? Businesses in decline often have two underlying trends, firstly, a declining return on capital employed (ROCE) and a declining base of capital employed. Basically the company is earning less on its investments and it is also reducing its total assets. And from a first read, things don't look too good at Movado Group (NYSE:MOV), so let's see why.
What Is Return On Capital Employed (ROCE)?
Just to clarify if you're unsure, ROCE is a metric for evaluating how much pre-tax income (in percentage terms) a company earns on the capital invested in its business. Analysts use this formula to calculate it for Movado Group:
Return on Capital Employed = Earnings Before Interest and Tax (EBIT) ÷ (Total Assets - Current Liabilities)
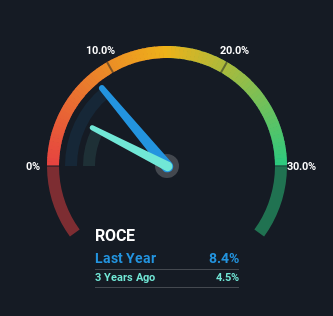
0.084 = US$55m ÷ (US$769m - US$113m) (Based on the trailing twelve months to January 2024).
So, Movado Group has an ROCE of 8.4%. Ultimately, that's a low return and it under-performs the Luxury industry average of 12%.
See our latest analysis for Movado Group
Above you can see how the current ROCE for Movado Group compares to its prior returns on capital, but there's only so much you can tell from the past. If you're interested, you can view the analysts predictions in our free analyst report for Movado Group .
The Trend Of ROCE
In terms of Movado Group's historical ROCE movements, the trend doesn't inspire confidence. About five years ago, returns on capital were 12%, however they're now substantially lower than that as we saw above. And on the capital employed front, the business is utilizing roughly the same amount of capital as it was back then. Companies that exhibit these attributes tend to not be shrinking, but they can be mature and facing pressure on their margins from competition. If these trends continue, we wouldn't expect Movado Group to turn into a multi-bagger.
The Key Takeaway
All in all, the lower returns from the same amount of capital employed aren't exactly signs of a compounding machine. And, the stock has remained flat over the last five years, so investors don't seem too impressed either. That being the case, unless the underlying trends revert to a more positive trajectory, we'd consider looking elsewhere.
One more thing, we've spotted 2 warning signs facing Movado Group that you might find interesting.
While Movado Group may not currently earn the highest returns, we've compiled a list of companies that currently earn more than 25% return on equity. Check out this free list here.
Have feedback on this article? Concerned about the content? Get in touch with us directly. Alternatively, email editorial-team (at) simplywallst.com.
This article by Simply Wall St is general in nature. We provide commentary based on historical data and analyst forecasts only using an unbiased methodology and our articles are not intended to be financial advice. It does not constitute a recommendation to buy or sell any stock, and does not take account of your objectives, or your financial situation. We aim to bring you long-term focused analysis driven by fundamental data. Note that our analysis may not factor in the latest price-sensitive company announcements or qualitative material. Simply Wall St has no position in any stocks mentioned.
