
 Yahoo Finance
 Kolibri Global Energy (TSE:KEI) Shareholders Will Want The ROCE Trajectory To Continue
What are the early trends we should look for to identify a stock that could multiply in value over the long term? Typically, we'll want to notice a trend of growing return on capital employed (ROCE) and alongside that, an expanding base of capital employed. This shows us that it's a compounding machine, able to continually reinvest its earnings back into the business and generate higher returns. Speaking of which, we noticed some great changes in Kolibri Global Energy's (TSE:KEI) returns on capital, so let's have a look.
What Is Return On Capital Employed (ROCE)?
For those that aren't sure what ROCE is, it measures the amount of pre-tax profits a company can generate from the capital employed in its business. To calculate this metric for Kolibri Global Energy, this is the formula:
Return on Capital Employed = Earnings Before Interest and Tax (EBIT) ÷ (Total Assets - Current Liabilities)
0.10 = US$19m ÷ (US$212m - US$20m) (Based on the trailing twelve months to September 2023).
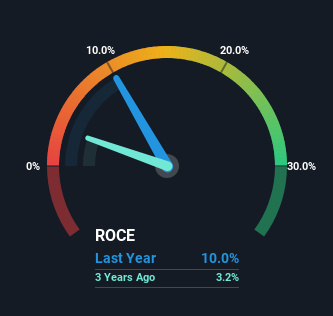
Thus, Kolibri Global Energy has an ROCE of 10.0%. On its own, that's a low figure but it's around the 8.9% average generated by the Oil and Gas industry.
See our latest analysis for Kolibri Global Energy
In the above chart we have measured Kolibri Global Energy's prior ROCE against its prior performance, but the future is arguably more important. If you'd like, you can check out the forecasts from the analysts covering Kolibri Global Energy for free.
So How Is Kolibri Global Energy's ROCE Trending?
While in absolute terms it isn't a high ROCE, it's promising to see that it has been moving in the right direction. The data shows that returns on capital have increased substantially over the last five years to 10.0%. Basically the business is earning more per dollar of capital invested and in addition to that, 26% more capital is being employed now too. So we're very much inspired by what we're seeing at Kolibri Global Energy thanks to its ability to profitably reinvest capital.
The Key Takeaway
A company that is growing its returns on capital and can consistently reinvest in itself is a highly sought after trait, and that's what Kolibri Global Energy has. And investors seem to expect more of this going forward, since the stock has rewarded shareholders with a 63% return over the last five years. So given the stock has proven it has promising trends, it's worth researching the company further to see if these trends are likely to persist.
If you want to know some of the risks facing Kolibri Global Energy we've found 2 warning signs (1 is potentially serious!) that you should be aware of before investing here.
For those who like to invest in solid companies, check out this free list of companies with solid balance sheets and high returns on equity.
Have feedback on this article? Concerned about the content? Get in touch with us directly. Alternatively, email editorial-team (at) simplywallst.com.
This article by Simply Wall St is general in nature. We provide commentary based on historical data and analyst forecasts only using an unbiased methodology and our articles are not intended to be financial advice. It does not constitute a recommendation to buy or sell any stock, and does not take account of your objectives, or your financial situation. We aim to bring you long-term focused analysis driven by fundamental data. Note that our analysis may not factor in the latest price-sensitive company announcements or qualitative material. Simply Wall St has no position in any stocks mentioned.
