
 Yahoo Finance
 Investors Will Want Karora Resources' (TSE:KRR) Growth In ROCE To Persist
What trends should we look for it we want to identify stocks that can multiply in value over the long term? Amongst other things, we'll want to see two things; firstly, a growing return on capital employed (ROCE) and secondly, an expansion in the company's amount of capital employed. Ultimately, this demonstrates that it's a business that is reinvesting profits at increasing rates of return. So on that note, Karora Resources (TSE:KRR) looks quite promising in regards to its trends of return on capital.
Return On Capital Employed (ROCE): What Is It?
For those who don't know, ROCE is a measure of a company's yearly pre-tax profit (its return), relative to the capital employed in the business. Analysts use this formula to calculate it for Karora Resources:
Return on Capital Employed = Earnings Before Interest and Tax (EBIT) ÷ (Total Assets - Current Liabilities)
0.10 = CA$54m ÷ (CA$584m - CA$66m) (Based on the trailing twelve months to September 2023).
Thus, Karora Resources has an ROCE of 10%. In absolute terms, that's a satisfactory return, but compared to the Metals and Mining industry average of 1.8% it's much better.
Check out our latest analysis for Karora Resources
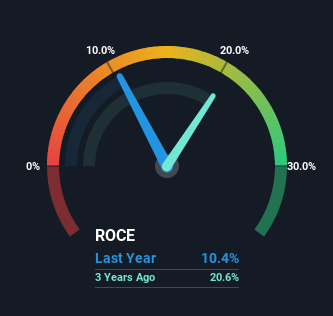
In the above chart we have measured Karora Resources' prior ROCE against its prior performance, but the future is arguably more important. If you'd like, you can check out the forecasts from the analysts covering Karora Resources for free.
How Are Returns Trending?
Karora Resources has recently broken into profitability so their prior investments seem to be paying off. The company was generating losses five years ago, but now it's earning 10% which is a sight for sore eyes. And unsurprisingly, like most companies trying to break into the black, Karora Resources is utilizing 3,403% more capital than it was five years ago. We like this trend, because it tells us the company has profitable reinvestment opportunities available to it, and if it continues going forward that can lead to a multi-bagger performance.
One more thing to note, Karora Resources has decreased current liabilities to 11% of total assets over this period, which effectively reduces the amount of funding from suppliers or short-term creditors. So shareholders would be pleased that the growth in returns has mostly come from underlying business performance.
In Conclusion...
Overall, Karora Resources gets a big tick from us thanks in most part to the fact that it is now profitable and is reinvesting in its business. And investors seem to expect more of this going forward, since the stock has rewarded shareholders with a 100% return over the last five years. Therefore, we think it would be worth your time to check if these trends are going to continue.
Like most companies, Karora Resources does come with some risks, and we've found 2 warning signs that you should be aware of.
While Karora Resources isn't earning the highest return, check out this free list of companies that are earning high returns on equity with solid balance sheets.
Have feedback on this article? Concerned about the content? Get in touch with us directly. Alternatively, email editorial-team (at) simplywallst.com.
This article by Simply Wall St is general in nature. We provide commentary based on historical data and analyst forecasts only using an unbiased methodology and our articles are not intended to be financial advice. It does not constitute a recommendation to buy or sell any stock, and does not take account of your objectives, or your financial situation. We aim to bring you long-term focused analysis driven by fundamental data. Note that our analysis may not factor in the latest price-sensitive company announcements or qualitative material. Simply Wall St has no position in any stocks mentioned.
