
 Yahoo Finance
 Investors Will Want Arko's (NASDAQ:ARKO) Growth In ROCE To Persist
If you're looking for a multi-bagger, there's a few things to keep an eye out for. One common approach is to try and find a company with returns on capital employed (ROCE) that are increasing, in conjunction with a growing amount of capital employed. Put simply, these types of businesses are compounding machines, meaning they are continually reinvesting their earnings at ever-higher rates of return. So when we looked at Arko (NASDAQ:ARKO) and its trend of ROCE, we really liked what we saw.
What Is Return On Capital Employed (ROCE)?
If you haven't worked with ROCE before, it measures the 'return' (pre-tax profit) a company generates from capital employed in its business. Analysts use this formula to calculate it for Arko:
Return on Capital Employed = Earnings Before Interest and Tax (EBIT) ÷ (Total Assets - Current Liabilities)
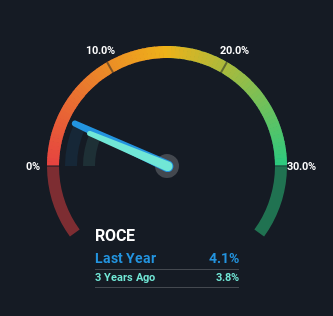
0.041 = US$130m ÷ (US$3.7b - US$486m) (Based on the trailing twelve months to December 2023).
Thus, Arko has an ROCE of 4.1%. In absolute terms, that's a low return and it also under-performs the Specialty Retail industry average of 13%.
See our latest analysis for Arko
In the above chart we have measured Arko's prior ROCE against its prior performance, but the future is arguably more important. If you'd like to see what analysts are forecasting going forward, you should check out our free analyst report for Arko .
What Does the ROCE Trend For Arko Tell Us?
Even though ROCE is still low in absolute terms, it's good to see it's heading in the right direction. The data shows that returns on capital have increased substantially over the last five years to 4.1%. The company is effectively making more money per dollar of capital used, and it's worth noting that the amount of capital has increased too, by 322%. So we're very much inspired by what we're seeing at Arko thanks to its ability to profitably reinvest capital.
One more thing to note, Arko has decreased current liabilities to 13% of total assets over this period, which effectively reduces the amount of funding from suppliers or short-term creditors. So shareholders would be pleased that the growth in returns has mostly come from underlying business performance.
The Bottom Line
In summary, it's great to see that Arko can compound returns by consistently reinvesting capital at increasing rates of return, because these are some of the key ingredients of those highly sought after multi-baggers. Astute investors may have an opportunity here because the stock has declined 57% in the last three years. With that in mind, we believe the promising trends warrant this stock for further investigation.
Arko does come with some risks though, we found 5 warning signs in our investment analysis, and 1 of those is a bit unpleasant...
If you want to search for solid companies with great earnings, check out this free list of companies with good balance sheets and impressive returns on equity.
Have feedback on this article? Concerned about the content? Get in touch with us directly. Alternatively, email editorial-team (at) simplywallst.com.
This article by Simply Wall St is general in nature. We provide commentary based on historical data and analyst forecasts only using an unbiased methodology and our articles are not intended to be financial advice. It does not constitute a recommendation to buy or sell any stock, and does not take account of your objectives, or your financial situation. We aim to bring you long-term focused analysis driven by fundamental data. Note that our analysis may not factor in the latest price-sensitive company announcements or qualitative material. Simply Wall St has no position in any stocks mentioned.
