
 Yahoo Finance
 Investors in Inghams Group (ASX:ING) have seen returns of 1.0% over the past five years
For many, the main point of investing is to generate higher returns than the overall market. But the main game is to find enough winners to more than offset the losers At this point some shareholders may be questioning their investment in Inghams Group Limited (ASX:ING), since the last five years saw the share price fall 19%.
With that in mind, it's worth seeing if the company's underlying fundamentals have been the driver of long term performance, or if there are some discrepancies.
Check out our latest analysis for Inghams Group
To paraphrase Benjamin Graham: Over the short term the market is a voting machine, but over the long term it's a weighing machine. One way to examine how market sentiment has changed over time is to look at the interaction between a company's share price and its earnings per share (EPS).
Looking back five years, both Inghams Group's share price and EPS declined; the latter at a rate of 4.3% per year. In this case, the EPS change is really very close to the share price drop of 4% a year. This implies that the market has had a fairly steady view of the stock. So it's fair to say the share price has been responding to changes in EPS.
The graphic below depicts how EPS has changed over time (unveil the exact values by clicking on the image).
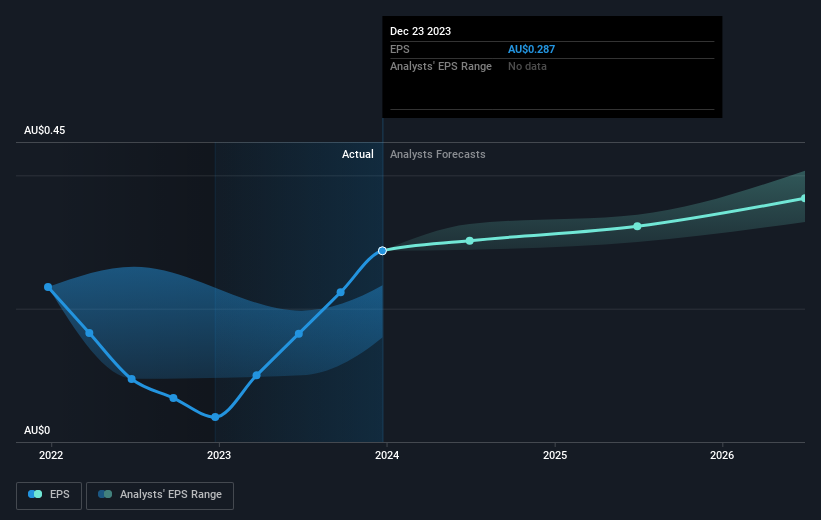
We know that Inghams Group has improved its bottom line lately, but is it going to grow revenue? You could check out this free report showing analyst revenue forecasts.
What About Dividends?
It is important to consider the total shareholder return, as well as the share price return, for any given stock. The TSR is a return calculation that accounts for the value of cash dividends (assuming that any dividend received was reinvested) and the calculated value of any discounted capital raisings and spin-offs. Arguably, the TSR gives a more comprehensive picture of the return generated by a stock. As it happens, Inghams Group's TSR for the last 5 years was 1.0%, which exceeds the share price return mentioned earlier. And there's no prize for guessing that the dividend payments largely explain the divergence!
A Different Perspective
It's nice to see that Inghams Group shareholders have received a total shareholder return of 26% over the last year. That's including the dividend. That's better than the annualised return of 0.2% over half a decade, implying that the company is doing better recently. Someone with an optimistic perspective could view the recent improvement in TSR as indicating that the business itself is getting better with time. It's always interesting to track share price performance over the longer term. But to understand Inghams Group better, we need to consider many other factors. For instance, we've identified 2 warning signs for Inghams Group (1 is concerning) that you should be aware of.
For those who like to find winning investments this free list of growing companies with recent insider purchasing, could be just the ticket.
Please note, the market returns quoted in this article reflect the market weighted average returns of stocks that currently trade on Australian exchanges.
Have feedback on this article? Concerned about the content? Get in touch with us directly. Alternatively, email editorial-team (at) simplywallst.com.
This article by Simply Wall St is general in nature. We provide commentary based on historical data and analyst forecasts only using an unbiased methodology and our articles are not intended to be financial advice. It does not constitute a recommendation to buy or sell any stock, and does not take account of your objectives, or your financial situation. We aim to bring you long-term focused analysis driven by fundamental data. Note that our analysis may not factor in the latest price-sensitive company announcements or qualitative material. Simply Wall St has no position in any stocks mentioned.
