
 Yahoo Finance
 Investors ignore increasing losses at PainChek (ASX:PCK) as stock jumps 37% this past week
These days it's easy to simply buy an index fund, and your returns should (roughly) match the market. But if you pick the right individual stocks, you could make more than that. For example, the PainChek Limited (ASX:PCK) share price is up 84% in the last 1 year, clearly besting the market return of around 1.5% (not including dividends). If it can keep that out-performance up over the long term, investors will do very well! Unfortunately the longer term returns are not so good, with the stock falling 38% in the last three years.
Since the stock has added AU$23m to its market cap in the past week alone, let's see if underlying performance has been driving long-term returns.
See our latest analysis for PainChek
Given that PainChek didn't make a profit in the last twelve months, we'll focus on revenue growth to form a quick view of its business development. When a company doesn't make profits, we'd generally expect to see good revenue growth. That's because fast revenue growth can be easily extrapolated to forecast profits, often of considerable size.
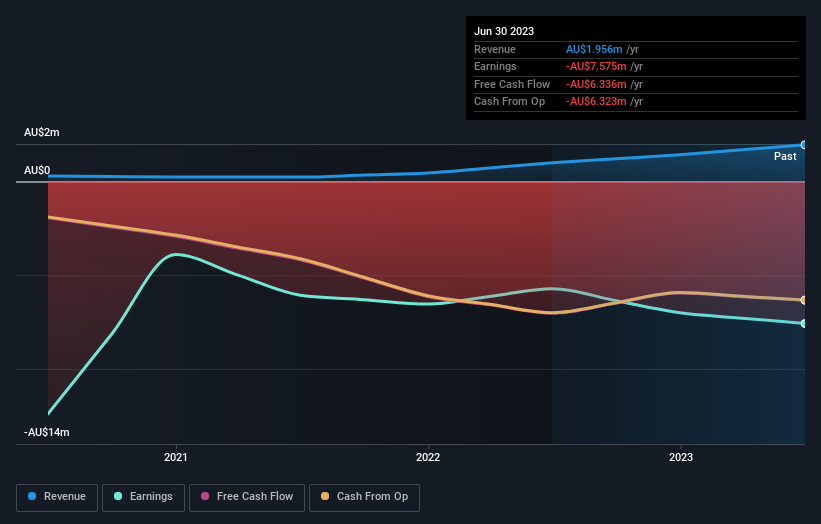
In the last year PainChek saw its revenue grow by 97%. That's stonking growth even when compared to other loss-making stocks. While the share price gain of 84% over twelve months is pretty tasty, you might argue it doesn't fully reflect the strong revenue growth. So quite frankly it could be a good time to investigate PainChek in some detail. Since we evolved from monkeys, we think in linear terms by nature. So if growth goes exponential, opportunity may exist for the enlightened.
You can see how earnings and revenue have changed over time in the image below (click on the chart to see the exact values).
This free interactive report on PainChek's balance sheet strength is a great place to start, if you want to investigate the stock further.
A Different Perspective
It's nice to see that PainChek shareholders have received a total shareholder return of 84% over the last year. Since the one-year TSR is better than the five-year TSR (the latter coming in at 1.9% per year), it would seem that the stock's performance has improved in recent times. Given the share price momentum remains strong, it might be worth taking a closer look at the stock, lest you miss an opportunity. I find it very interesting to look at share price over the long term as a proxy for business performance. But to truly gain insight, we need to consider other information, too. Consider for instance, the ever-present spectre of investment risk. We've identified 6 warning signs with PainChek (at least 2 which are potentially serious) , and understanding them should be part of your investment process.
Of course, you might find a fantastic investment by looking elsewhere. So take a peek at this free list of companies we expect will grow earnings.
Please note, the market returns quoted in this article reflect the market weighted average returns of stocks that currently trade on Australian exchanges.
Have feedback on this article? Concerned about the content? Get in touch with us directly. Alternatively, email editorial-team (at) simplywallst.com.
This article by Simply Wall St is general in nature. We provide commentary based on historical data and analyst forecasts only using an unbiased methodology and our articles are not intended to be financial advice. It does not constitute a recommendation to buy or sell any stock, and does not take account of your objectives, or your financial situation. We aim to bring you long-term focused analysis driven by fundamental data. Note that our analysis may not factor in the latest price-sensitive company announcements or qualitative material. Simply Wall St has no position in any stocks mentioned.
