
 Yahoo Finance
 HealthEquity (HQY) Q1 Earnings Surpass Estimates, Margins Up
HealthEquity, Inc. HQY reported adjusted earnings per share (EPS) of 80 cents in first-quarter fiscal 2025, which surpassed the Zacks Consensus Estimate by 21.2%. The bottom line improved 60% on a year-over-year basis.
GAAP EPS in the fiscal first quarter was 33 cents, up 560% compared with the year-ago quarter’s EPS of 5 cents.
Revenues in Detail
In the fiscal first quarter, the company generated revenues of $287.6 million, which beat the Zacks Consensus Estimate by 3.2%. The top line improved 17.7% from the prior-year quarter.
HSA Details
As of Apr 30, 2024, the total number of Health Savings Accounts (HSA) for which HealthEquity served as a non-bank custodian (HSA members) was 9.1 million, up 13.1% year over year.
HealthEquity reported 665,000 HSAs with investments as of Apr 30, 2024, up 19.6% year over year. Total Accounts, as of Apr 30, 2024, were 16 million, up 6.7% year over year. This uptick included total HSAs and 6.9 million other Consumer Direct Benefits (CDBs), down 0.6% year over year.
Total HSA assets were $27.28 billion at the end of Apr 30, 2024, up 22.2% year over year. This included $15.85 billion of HSA cash (up 12.3% year over year) and $11.43 billion of HSA investments (up 39.3% year over year).
This figure compares to our fiscal first-quarter HSA cash and HSA investments projection of $15.1 billion and $9.9 billion, respectively. We had projected total HSA assets of $25.1 billion in the fiscal first quarter.
Client-held funds, which are deposits held on behalf of HealthEquity’s clients to facilitate the administration of its CDBs and from which the company generates custodial revenues, were $0.86 billion (down 7.3% year over year) as of Apr 30, 2024.
Revenue Sources
HealthEquity derives revenues from three sources: Service revenues, Custodial revenues and Interchange revenues.
Service revenues totaled $118.2 million in the quarter, up 6.4% year over year. This reflected a higher number of HSAs and invested HSA Assets, partially offset by the runoff of National Emergency CDB activity. Service revenues also benefited from a $2.5 million catch-up accrual of investment record-keeping fees in the quarter that will not be repeated in subsequent quarters. This figure compares to our Service revenues’ fiscal first-quarter projection of $112.5 million.
Custodial revenues totaled $121.6 million, up 37.5% from the year-ago period. This figure compares to our Custodial revenues’ fiscal first-quarter projection of $119.4 million.
Interchange revenues totaled $47.7 million, up 6.4% year over year. This figure compares to our Interchange revenues’ fiscal first-quarter projection of $45.1 million.
HealthEquity, Inc. Price, Consensus and EPS Surprise
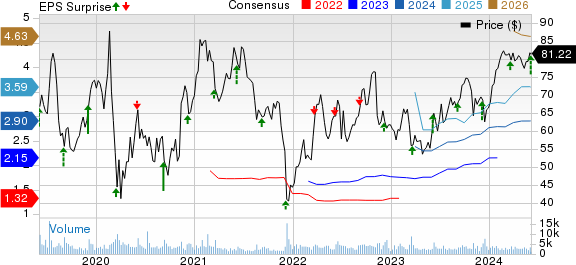
HealthEquity, Inc. price-consensus-eps-surprise-chart | HealthEquity, Inc. Quote
Margin Details
In the quarter under review, HealthEquity’s gross profit rose 26% to $187.1 million. The gross margin expanded 433 basis points (bps) to 65.1%. We had projected 61.3% of gross margin for the fiscal first quarter.
Sales and marketing expenses climbed 17.9% to $23.5 million year over year, whereas technology and development expenses climbed 5.4% to $56.1 million. General and administrative expenses also increased 49.7% year over year to $38.2 million. Adjusted operating expenses of $117.8 million increased 19.4%.
Adjusted operating profit totaled $69.3 million, improving 39.2% from the prior-year quarter. Adjusted operating margin in the quarter expanded 373 bps to 24.1%.
Financial Position
The company exited first-quarter fiscal 2025 with cash and cash equivalents of $251.2 million compared with $403.9 million at the fiscal 2024-end. Total debt (net of issuance costs) at the end of first-quarter fiscal 2025 was $925.7 million compared with $874.9 million at the end of fiscal 2024.
Net cash flow from operating activities at the end of first-quarter fiscal 2025 totaled $65.4 million compared with $31.5 million in the year-ago period.
FY25 Guidance
HealthEquity has upped its revenue and EPS projections for fiscal 2025.
For fiscal 2025, revenues are now projected to be between $1.16 billion and $1.18 billion, up from the previous outlook of $1.14 billion and $1.16 billion. The Zacks Consensus Estimate is currently pegged at $1.15 billion.
Adjusted EPS is now expected to be in the range of $2.93-$3.10, up from the earlier guidance of $2.79-$2.96. The Zacks Consensus Estimate currently stands at $2.90.
Our Take
HealthEquity exited first-quarter fiscal 2025 with better-than-expected results. The company witnessed solid top-line and bottom-line performances in the reported quarter. The top line benefited from robust contributions from all its revenue sources. Solid growth in HSAs also drove the top line. The solid uptick in total HSA assets in the reported quarter is promising. The expansion of both margins also bodes well. Management’s expectations of the impacts of the BenefitWallet HSA portfolio acquisition raise optimism.
During the quarter, HealthEquity launched more AI-driven service tech, expanded its claims automation for FSA members and deployed its stacked account card for iOS and Android mobile wallets to select enterprise clients. The company also added insurer partners and capacity in the Enhanced Rates program that accommodated greater-than-expected adoption. These also look promising.
However, the decline in CDBs and Client-held funds in the reported quarter is disappointing.
Zacks Rank and Other Key Picks
HealthEquity currently carries a Zacks Rank #2 (Buy).
A few other top-ranked stocks in the broader medical space that have announced quarterly results are Align Technology, Inc. ALGN, ResMed Inc. RMD and Boston Scientific Corporation BSX.
Align Technology, carrying a Zacks Rank of 2, reported first-quarter 2024 adjusted EPS of $2.14, which beat the Zacks Consensus Estimate by 8.1%. Revenues of $997.4 million outpaced the consensus mark by 2.6%. You can see the complete list of today’s Zacks #1 Rank (Strong Buy) stocks here.
Align Technology has a long-term estimated growth rate of 6.9%. ALGN’s earnings surpassed estimates in three of the trailing four quarters and missed once, the average surprise being 5.9%.
ResMed reported third-quarter fiscal 2024 adjusted EPS of $2.13, which beat the Zacks Consensus Estimate by 10.9%. Revenues of $1.19 billion surpassed the Zacks Consensus Estimate by 1.9%. It currently sports a Zacks Rank #1.
ResMed has a long-term estimated growth rate of 13.2%. RMD’s earnings surpassed estimates in three of the trailing four quarters and missed once, the average surprise being 2.8%.
Boston Scientific reported first-quarter 2024 adjusted EPS of 56 cents, which beat the Zacks Consensus Estimate by 9.8%. Revenues of $3.86 billion surpassed the Zacks Consensus Estimate by 4.9%. It currently carries a Zacks Rank #2.
Boston Scientific has a long-term estimated growth rate of 12.5%. BSX’s earnings surpassed estimates in all the trailing four quarters, the average surprise being 7.5%.
Want the latest recommendations from Zacks Investment Research? Today, you can download 7 Best Stocks for the Next 30 Days. Click to get this free report
Boston Scientific Corporation (BSX) : Free Stock Analysis Report
Align Technology, Inc. (ALGN) : Free Stock Analysis Report
ResMed Inc. (RMD) : Free Stock Analysis Report
HealthEquity, Inc. (HQY) : Free Stock Analysis Report
