
 Yahoo Finance
 Cogeco (TSE:CGO) investors are sitting on a loss of 42% if they invested three years ago
As an investor its worth striving to ensure your overall portfolio beats the market average. But if you try your hand at stock picking, you risk returning less than the market. We regret to report that long term Cogeco Inc. (TSE:CGO) shareholders have had that experience, with the share price dropping 50% in three years, versus a market return of about 20%. The falls have accelerated recently, with the share price down 19% in the last three months.
So let's have a look and see if the longer term performance of the company has been in line with the underlying business' progress.
Check out our latest analysis for Cogeco
In his essay The Superinvestors of Graham-and-Doddsville Warren Buffett described how share prices do not always rationally reflect the value of a business. One way to examine how market sentiment has changed over time is to look at the interaction between a company's share price and its earnings per share (EPS).
During the three years that the share price fell, Cogeco's earnings per share (EPS) dropped by 13% each year. The share price decline of 20% is actually steeper than the EPS slippage. So it seems the market was too confident about the business, in the past. The less favorable sentiment is reflected in its current P/E ratio of 8.47.
The image below shows how EPS has tracked over time (if you click on the image you can see greater detail).
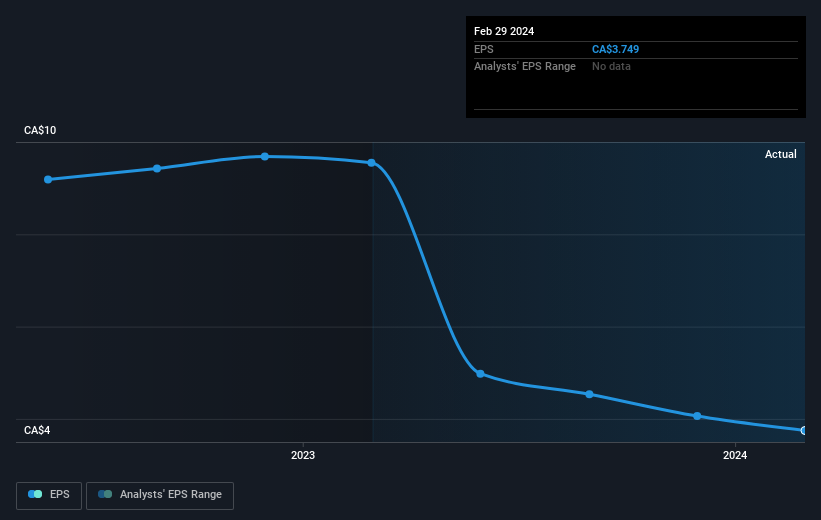
It might be well worthwhile taking a look at our free report on Cogeco's earnings, revenue and cash flow.
What About Dividends?
When looking at investment returns, it is important to consider the difference between total shareholder return (TSR) and share price return. Whereas the share price return only reflects the change in the share price, the TSR includes the value of dividends (assuming they were reinvested) and the benefit of any discounted capital raising or spin-off. Arguably, the TSR gives a more comprehensive picture of the return generated by a stock. We note that for Cogeco the TSR over the last 3 years was -42%, which is better than the share price return mentioned above. This is largely a result of its dividend payments!
A Different Perspective
While the broader market gained around 16% in the last year, Cogeco shareholders lost 4.7% (even including dividends). However, keep in mind that even the best stocks will sometimes underperform the market over a twelve month period. Unfortunately, longer term shareholders are suffering worse, given the loss of 6% doled out over the last five years. We'd need to see some sustained improvements in the key metrics before we could muster much enthusiasm. I find it very interesting to look at share price over the long term as a proxy for business performance. But to truly gain insight, we need to consider other information, too. Even so, be aware that Cogeco is showing 3 warning signs in our investment analysis , and 1 of those is a bit concerning...
If you are like me, then you will not want to miss this free list of undervalued small caps that insiders are buying.
Please note, the market returns quoted in this article reflect the market weighted average returns of stocks that currently trade on Canadian exchanges.
Have feedback on this article? Concerned about the content? Get in touch with us directly. Alternatively, email editorial-team (at) simplywallst.com.
This article by Simply Wall St is general in nature. We provide commentary based on historical data and analyst forecasts only using an unbiased methodology and our articles are not intended to be financial advice. It does not constitute a recommendation to buy or sell any stock, and does not take account of your objectives, or your financial situation. We aim to bring you long-term focused analysis driven by fundamental data. Note that our analysis may not factor in the latest price-sensitive company announcements or qualitative material. Simply Wall St has no position in any stocks mentioned.
