
 Yahoo Finance
 Carter's (NYSE:CRI) Hasn't Managed To Accelerate Its Returns
To find a multi-bagger stock, what are the underlying trends we should look for in a business? In a perfect world, we'd like to see a company investing more capital into its business and ideally the returns earned from that capital are also increasing. Ultimately, this demonstrates that it's a business that is reinvesting profits at increasing rates of return. In light of that, when we looked at Carter's (NYSE:CRI) and its ROCE trend, we weren't exactly thrilled.
Return On Capital Employed (ROCE): What Is It?
If you haven't worked with ROCE before, it measures the 'return' (pre-tax profit) a company generates from capital employed in its business. The formula for this calculation on Carter's is:
Return on Capital Employed = Earnings Before Interest and Tax (EBIT) ÷ (Total Assets - Current Liabilities)
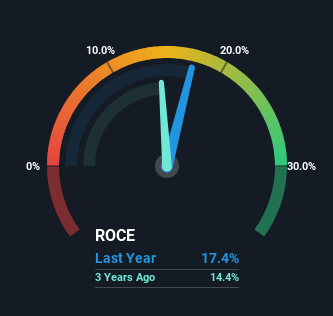
0.17 = US$324m ÷ (US$2.3b - US$419m) (Based on the trailing twelve months to March 2024).
So, Carter's has an ROCE of 17%. On its own, that's a standard return, however it's much better than the 12% generated by the Luxury industry.
View our latest analysis for Carter's
In the above chart we have measured Carter's' prior ROCE against its prior performance, but the future is arguably more important. If you'd like to see what analysts are forecasting going forward, you should check out our free analyst report for Carter's .
What Does the ROCE Trend For Carter's Tell Us?
There hasn't been much to report for Carter's' returns and its level of capital employed because both metrics have been steady for the past five years. This tells us the company isn't reinvesting in itself, so it's plausible that it's past the growth phase. So don't be surprised if Carter's doesn't end up being a multi-bagger in a few years time. This probably explains why Carter's is paying out 49% of its income to shareholders in the form of dividends. Unless businesses have highly compelling growth opportunities, they'll typically return some money to shareholders.
In Conclusion...
We can conclude that in regards to Carter's' returns on capital employed and the trends, there isn't much change to report on. And in the last five years, the stock has given away 13% so the market doesn't look too hopeful on these trends strengthening any time soon. In any case, the stock doesn't have these traits of a multi-bagger discussed above, so if that's what you're looking for, we think you'd have more luck elsewhere.
On a final note, we've found 2 warning signs for Carter's that we think you should be aware of.
While Carter's may not currently earn the highest returns, we've compiled a list of companies that currently earn more than 25% return on equity. Check out this free list here.
Have feedback on this article? Concerned about the content? Get in touch with us directly. Alternatively, email editorial-team (at) simplywallst.com.
This article by Simply Wall St is general in nature. We provide commentary based on historical data and analyst forecasts only using an unbiased methodology and our articles are not intended to be financial advice. It does not constitute a recommendation to buy or sell any stock, and does not take account of your objectives, or your financial situation. We aim to bring you long-term focused analysis driven by fundamental data. Note that our analysis may not factor in the latest price-sensitive company announcements or qualitative material. Simply Wall St has no position in any stocks mentioned.
