The TJX Companies, Inc. (TJX.MX)
Mexico - Mexico Delayed price. Currency in MXN
Add to watchlist
At close: 01:30PM CST
| Previous close | 2,034.13 |
| Open | 2,027.85 |
| Bid | 1,900.00 x 100 |
| Ask | 2,156.00 x 2000 |
| Day's range | 1,989.60 - 2,034.53 |
| 52-week range | 1,393.15 - 2,034.53 |
| Volume | |
| Avg. volume | 407 |
| Market cap | 2.299T |
| Beta (5Y monthly) | 0.88 |
| PE ratio (TTM) | 27.40 |
| EPS (TTM) | 74.25 |
| Earnings date | 21 Aug 2024 - 22 Aug 2024 |
| Forward dividend & yield | 26.56 (1.31%) |
| Ex-dividend date | 15 Aug 2024 |
| 1y target est | N/A |
 Insider Monkey
Offset Tech Concentration Risk: Is TJX Companies Inc (NYSE:TJX) The Best Non-AI Stock to Buy in 2024
We recently published a list of the Analyst Recommends 10 Best Stocks to Diversify Your Portfolio Away from Mega-Cap Tech and AI Stocks. Since TJX Companies Inc (NYSE:TJX) ranks 6th on the list, it deserves a deeper look. Venu Krishna, Head of U.S. Equity Strategy & Global Equity Linked Strategies at Barclays, recently shared a basket […]
 Investor's Business Daily
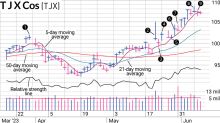
Pullback After TJX Earnings Gap Provided Entry
TJX provides an example of swing trading after an earnings gap. This latest report saw TJX jump 7.5% at its peak after its earnings report (2). By the end of the day, it was at the lows of its trading range and up only 3.5%.
 Zacks
ZacksHere is What to Know Beyond Why The TJX Companies, Inc. (TJX) is a Trending Stock
Recently, Zacks.com users have been paying close attention to TJX (TJX). This makes it worthwhile to examine what the stock has in store.
© 2024 Yahoo. All rights reserved.