
 Yahoo Finance
 ZoomerMedia (CVE:ZUM) Might Have The Makings Of A Multi-Bagger
There are a few key trends to look for if we want to identify the next multi-bagger. One common approach is to try and find a company with returns on capital employed (ROCE) that are increasing, in conjunction with a growing amount of capital employed. Ultimately, this demonstrates that it's a business that is reinvesting profits at increasing rates of return. Speaking of which, we noticed some great changes in ZoomerMedia's (CVE:ZUM) returns on capital, so let's have a look.
What Is Return On Capital Employed (ROCE)?
If you haven't worked with ROCE before, it measures the 'return' (pre-tax profit) a company generates from capital employed in its business. To calculate this metric for ZoomerMedia, this is the formula:
Return on Capital Employed = Earnings Before Interest and Tax (EBIT) ÷ (Total Assets - Current Liabilities)
0.025 = CA$2.3m ÷ (CA$99m - CA$9.5m) (Based on the trailing twelve months to May 2023).
Therefore, ZoomerMedia has an ROCE of 2.5%. In absolute terms, that's a low return and it also under-performs the Media industry average of 8.9%.
See our latest analysis for ZoomerMedia
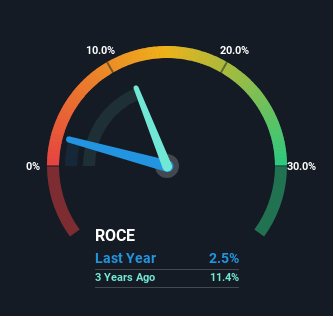
Historical performance is a great place to start when researching a stock so above you can see the gauge for ZoomerMedia's ROCE against it's prior returns. If you want to delve into the historical earnings, revenue and cash flow of ZoomerMedia, check out these free graphs here.
What Can We Tell From ZoomerMedia's ROCE Trend?
We're delighted to see that ZoomerMedia is reaping rewards from its investments and is now generating some pre-tax profits. The company was generating losses five years ago, but now it's earning 2.5% which is a sight for sore eyes. And unsurprisingly, like most companies trying to break into the black, ZoomerMedia is utilizing 115% more capital than it was five years ago. We like this trend, because it tells us the company has profitable reinvestment opportunities available to it, and if it continues going forward that can lead to a multi-bagger performance.
What We Can Learn From ZoomerMedia's ROCE
To the delight of most shareholders, ZoomerMedia has now broken into profitability. Since the stock has returned a staggering 154% to shareholders over the last five years, it looks like investors are recognizing these changes. Therefore, we think it would be worth your time to check if these trends are going to continue.
One more thing: We've identified 3 warning signs with ZoomerMedia (at least 2 which are concerning) , and understanding them would certainly be useful.
If you want to search for solid companies with great earnings, check out this free list of companies with good balance sheets and impressive returns on equity.
Have feedback on this article? Concerned about the content? Get in touch with us directly. Alternatively, email editorial-team (at) simplywallst.com.
This article by Simply Wall St is general in nature. We provide commentary based on historical data and analyst forecasts only using an unbiased methodology and our articles are not intended to be financial advice. It does not constitute a recommendation to buy or sell any stock, and does not take account of your objectives, or your financial situation. We aim to bring you long-term focused analysis driven by fundamental data. Note that our analysis may not factor in the latest price-sensitive company announcements or qualitative material. Simply Wall St has no position in any stocks mentioned.
