
 Yahoo Finance
 Zip Co (ASX:ZIP) adds AU$99m to market cap in the past 7 days, though investors from three years ago are still down 90%
Zip Co Limited (ASX:ZIP) shareholders will doubtless be very grateful to see the share price up 75% in the last quarter. But only the myopic could ignore the astounding decline over three years. In that time the share price has melted like a snowball in the desert, down 90%. So it sure is nice to see a bit of an improvement. Of course the real question is whether the business can sustain a turnaround. We really feel for shareholders in this scenario. It's a good reminder of the importance of diversification, and it's worth keeping in mind there's more to life than money, anyway.
On a more encouraging note the company has added AU$99m to its market cap in just the last 7 days, so let's see if we can determine what's driven the three-year loss for shareholders.
See our latest analysis for Zip Co
Because Zip Co made a loss in the last twelve months, we think the market is probably more focussed on revenue and revenue growth, at least for now. Shareholders of unprofitable companies usually expect strong revenue growth. That's because fast revenue growth can be easily extrapolated to forecast profits, often of considerable size.
Over three years, Zip Co grew revenue at 40% per year. That's well above most other pre-profit companies. So why has the share priced crashed 24% per year, in the same time? The share price makes us wonder if there is an issue with profitability. Sometimes fast revenue growth doesn't lead to profits. If the company is low on cash, it may have to raise capital soon.
You can see below how earnings and revenue have changed over time (discover the exact values by clicking on the image).
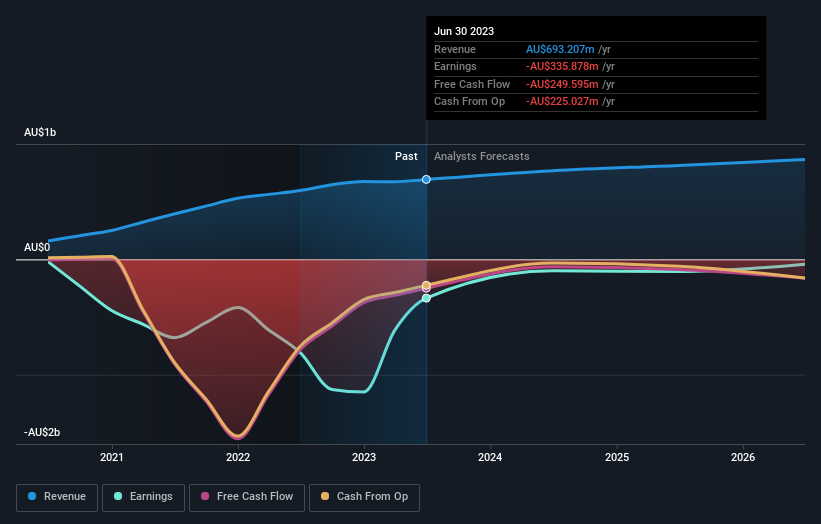
Balance sheet strength is crucial. It might be well worthwhile taking a look at our free report on how its financial position has changed over time.
A Different Perspective
Investors in Zip Co had a tough year, with a total loss of 26%, against a market gain of about 3.6%. Even the share prices of good stocks drop sometimes, but we want to see improvements in the fundamental metrics of a business, before getting too interested. Unfortunately, last year's performance may indicate unresolved challenges, given that it was worse than the annualised loss of 8% over the last half decade. We realise that Baron Rothschild has said investors should "buy when there is blood on the streets", but we caution that investors should first be sure they are buying a high quality business. It's always interesting to track share price performance over the longer term. But to understand Zip Co better, we need to consider many other factors. Even so, be aware that Zip Co is showing 3 warning signs in our investment analysis , you should know about...
We will like Zip Co better if we see some big insider buys. While we wait, check out this free list of growing companies with considerable, recent, insider buying.
Please note, the market returns quoted in this article reflect the market weighted average returns of stocks that currently trade on Australian exchanges.
Have feedback on this article? Concerned about the content? Get in touch with us directly. Alternatively, email editorial-team (at) simplywallst.com.
This article by Simply Wall St is general in nature. We provide commentary based on historical data and analyst forecasts only using an unbiased methodology and our articles are not intended to be financial advice. It does not constitute a recommendation to buy or sell any stock, and does not take account of your objectives, or your financial situation. We aim to bring you long-term focused analysis driven by fundamental data. Note that our analysis may not factor in the latest price-sensitive company announcements or qualitative material. Simply Wall St has no position in any stocks mentioned.
