
 Yahoo Finance
 Zephyr Energy (LON:ZPHR) shareholders are still up 626% over 3 years despite pulling back 12% in the past week
Zephyr Energy plc (LON:ZPHR) shareholders might be concerned after seeing the share price drop 15% in the last quarter. But over three years the performance has been really wonderful. Over that time, we've been excited to watch the share price climb an impressive 626%. As long term investors the recent fall doesn't detract all that much from the longer term story. Only time will tell if there is still too much optimism currently reflected in the share price. Anyone who held for that rewarding ride would probably be keen to talk about it.
While this past week has detracted from the company's three-year return, let's look at the recent trends of the underlying business and see if the gains have been in alignment.
View our latest analysis for Zephyr Energy
While the efficient markets hypothesis continues to be taught by some, it has been proven that markets are over-reactive dynamic systems, and investors are not always rational. One imperfect but simple way to consider how the market perception of a company has shifted is to compare the change in the earnings per share (EPS) with the share price movement.
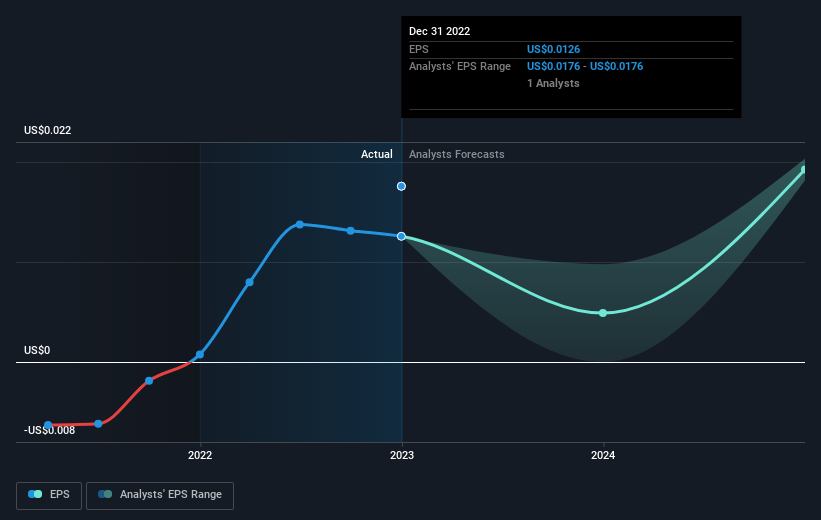
Zephyr Energy became profitable within the last three years. Given the importance of this milestone, it's not overly surprising that the share price has increased strongly.
You can see how EPS has changed over time in the image below (click on the chart to see the exact values).
We know that Zephyr Energy has improved its bottom line over the last three years, but what does the future have in store? You can see how its balance sheet has strengthened (or weakened) over time in this free interactive graphic.
A Different Perspective
While the broader market lost about 3.6% in the twelve months, Zephyr Energy shareholders did even worse, losing 27%. Having said that, it's inevitable that some stocks will be oversold in a falling market. The key is to keep your eyes on the fundamental developments. Longer term investors wouldn't be so upset, since they would have made 6%, each year, over five years. If the fundamental data continues to indicate long term sustainable growth, the current sell-off could be an opportunity worth considering. I find it very interesting to look at share price over the long term as a proxy for business performance. But to truly gain insight, we need to consider other information, too. Case in point: We've spotted 4 warning signs for Zephyr Energy you should be aware of, and 1 of them is significant.
For those who like to find winning investments this free list of growing companies with recent insider purchasing, could be just the ticket.
Please note, the market returns quoted in this article reflect the market weighted average returns of stocks that currently trade on British exchanges.
Have feedback on this article? Concerned about the content? Get in touch with us directly. Alternatively, email editorial-team (at) simplywallst.com.
This article by Simply Wall St is general in nature. We provide commentary based on historical data and analyst forecasts only using an unbiased methodology and our articles are not intended to be financial advice. It does not constitute a recommendation to buy or sell any stock, and does not take account of your objectives, or your financial situation. We aim to bring you long-term focused analysis driven by fundamental data. Note that our analysis may not factor in the latest price-sensitive company announcements or qualitative material. Simply Wall St has no position in any stocks mentioned.
