
 Yahoo Finance
 Yalla Group Limited's (NYSE:YALA) Stock Has Been Sliding But Fundamentals Look Strong: Is The Market Wrong?
With its stock down 11% over the past week, it is easy to disregard Yalla Group (NYSE:YALA). However, stock prices are usually driven by a company’s financial performance over the long term, which in this case looks quite promising. Specifically, we decided to study Yalla Group's ROE in this article.
ROE or return on equity is a useful tool to assess how effectively a company can generate returns on the investment it received from its shareholders. In simpler terms, it measures the profitability of a company in relation to shareholder's equity.
See our latest analysis for Yalla Group
How To Calculate Return On Equity?
ROE can be calculated by using the formula:
Return on Equity = Net Profit (from continuing operations) ÷ Shareholders' Equity
So, based on the above formula, the ROE for Yalla Group is:
20% = US$82m ÷ US$417m (Based on the trailing twelve months to September 2022).
The 'return' is the yearly profit. So, this means that for every $1 of its shareholder's investments, the company generates a profit of $0.20.
What Has ROE Got To Do With Earnings Growth?
Thus far, we have learned that ROE measures how efficiently a company is generating its profits. We now need to evaluate how much profit the company reinvests or "retains" for future growth which then gives us an idea about the growth potential of the company. Assuming everything else remains unchanged, the higher the ROE and profit retention, the higher the growth rate of a company compared to companies that don't necessarily bear these characteristics.
Yalla Group's Earnings Growth And 20% ROE
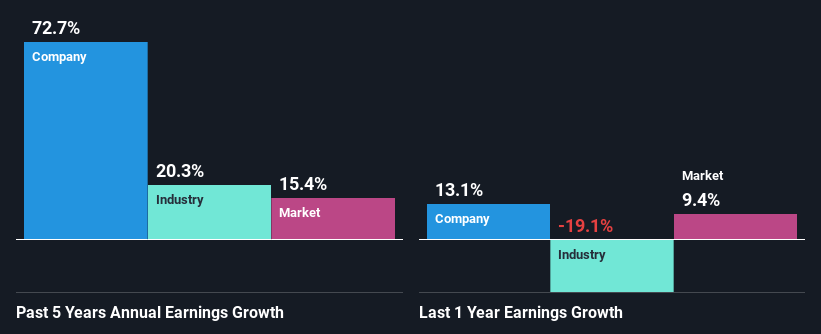
To start with, Yalla Group's ROE looks acceptable. Especially when compared to the industry average of 9.5% the company's ROE looks pretty impressive. This certainly adds some context to Yalla Group's exceptional 73% net income growth seen over the past five years. However, there could also be other causes behind this growth. Such as - high earnings retention or an efficient management in place.
Next, on comparing with the industry net income growth, we found that Yalla Group's growth is quite high when compared to the industry average growth of 20% in the same period, which is great to see.
Earnings growth is an important metric to consider when valuing a stock. What investors need to determine next is if the expected earnings growth, or the lack of it, is already built into the share price. Doing so will help them establish if the stock's future looks promising or ominous. If you're wondering about Yalla Group's's valuation, check out this gauge of its price-to-earnings ratio, as compared to its industry.
Is Yalla Group Using Its Retained Earnings Effectively?
Yalla Group doesn't pay any dividend to its shareholders, meaning that the company has been reinvesting all of its profits into the business. This is likely what's driving the high earnings growth number discussed above.
Summary
On the whole, we feel that Yalla Group's performance has been quite good. Particularly, we like that the company is reinvesting heavily into its business, and at a high rate of return. Unsurprisingly, this has led to an impressive earnings growth. With that said, the latest industry analyst forecasts reveal that the company's earnings growth is expected to slow down. Are these analysts expectations based on the broad expectations for the industry, or on the company's fundamentals? Click here to be taken to our analyst's forecasts page for the company.
Have feedback on this article? Concerned about the content? Get in touch with us directly. Alternatively, email editorial-team (at) simplywallst.com.
This article by Simply Wall St is general in nature. We provide commentary based on historical data and analyst forecasts only using an unbiased methodology and our articles are not intended to be financial advice. It does not constitute a recommendation to buy or sell any stock, and does not take account of your objectives, or your financial situation. We aim to bring you long-term focused analysis driven by fundamental data. Note that our analysis may not factor in the latest price-sensitive company announcements or qualitative material. Simply Wall St has no position in any stocks mentioned.
Join A Paid User Research Session
You’ll receive a US$30 Amazon Gift card for 1 hour of your time while helping us build better investing tools for the individual investors like yourself. Sign up here
