
 Yahoo Finance
 Xero Limited's (ASX:XRO) Stock Is Going Strong: Have Financials A Role To Play?
Xero (ASX:XRO) has had a great run on the share market with its stock up by a significant 29% over the last month. As most would know, fundamentals are what usually guide market price movements over the long-term, so we decided to look at the company's key financial indicators today to determine if they have any role to play in the recent price movement. Particularly, we will be paying attention to Xero's ROE today.
Return on Equity or ROE is a test of how effectively a company is growing its value and managing investors’ money. In short, ROE shows the profit each dollar generates with respect to its shareholder investments.
Check out our latest analysis for Xero
How Is ROE Calculated?
ROE can be calculated by using the formula:
Return on Equity = Net Profit (from continuing operations) ÷ Shareholders' Equity
So, based on the above formula, the ROE for Xero is:
7.1% = NZ$36m ÷ NZ$515m (Based on the trailing twelve months to September 2020).
The 'return' is the yearly profit. So, this means that for every A$1 of its shareholder's investments, the company generates a profit of A$0.07.
Why Is ROE Important For Earnings Growth?
So far, we've learned that ROE is a measure of a company's profitability. We now need to evaluate how much profit the company reinvests or "retains" for future growth which then gives us an idea about the growth potential of the company. Generally speaking, other things being equal, firms with a high return on equity and profit retention, have a higher growth rate than firms that don’t share these attributes.
Xero's Earnings Growth And 7.1% ROE
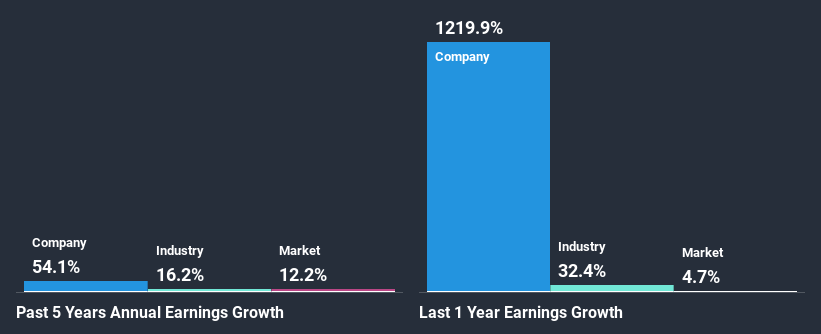
At first glance, Xero's ROE doesn't look very promising. We then compared the company's ROE to the broader industry and were disappointed to see that the ROE is lower than the industry average of 15%. Despite this, surprisingly, Xero saw an exceptional 54% net income growth over the past five years. So, there might be other aspects that are positively influencing the company's earnings growth. Such as - high earnings retention or an efficient management in place.
Next, on comparing with the industry net income growth, we found that Xero's growth is quite high when compared to the industry average growth of 16% in the same period, which is great to see.
The basis for attaching value to a company is, to a great extent, tied to its earnings growth. It’s important for an investor to know whether the market has priced in the company's expected earnings growth (or decline). Doing so will help them establish if the stock's future looks promising or ominous. Is Xero fairly valued compared to other companies? These 3 valuation measures might help you decide.
Is Xero Making Efficient Use Of Its Profits?
Conclusion
On the whole, we do feel that Xero has some positive attributes. Even in spite of the low rate of return, the company has posted impressive earnings growth as a result of reinvesting heavily into its business. Having said that, the company's earnings growth is expected to slow down, as forecasted in the current analyst estimates. Are these analysts expectations based on the broad expectations for the industry, or on the company's fundamentals? Click here to be taken to our analyst's forecasts page for the company.
This article by Simply Wall St is general in nature. It does not constitute a recommendation to buy or sell any stock, and does not take account of your objectives, or your financial situation. We aim to bring you long-term focused analysis driven by fundamental data. Note that our analysis may not factor in the latest price-sensitive company announcements or qualitative material. Simply Wall St has no position in any stocks mentioned.
Have feedback on this article? Concerned about the content? Get in touch with us directly. Alternatively, email editorial-team (at) simplywallst.com.
