
 Yahoo Finance
 Xero (ASX:XRO) Is Experiencing Growth In Returns On Capital
To find a multi-bagger stock, what are the underlying trends we should look for in a business? Typically, we'll want to notice a trend of growing return on capital employed (ROCE) and alongside that, an expanding base of capital employed. If you see this, it typically means it's a company with a great business model and plenty of profitable reinvestment opportunities. Speaking of which, we noticed some great changes in Xero's (ASX:XRO) returns on capital, so let's have a look.
Return On Capital Employed (ROCE): What Is It?
Just to clarify if you're unsure, ROCE is a metric for evaluating how much pre-tax income (in percentage terms) a company earns on the capital invested in its business. The formula for this calculation on Xero is:
Return on Capital Employed = Earnings Before Interest and Tax (EBIT) ÷ (Total Assets - Current Liabilities)
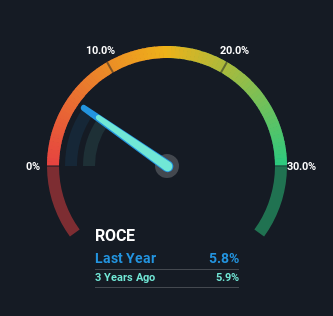
0.058 = NZ$141m ÷ (NZ$2.6b - NZ$229m) (Based on the trailing twelve months to September 2023).
So, Xero has an ROCE of 5.8%. Ultimately, that's a low return and it under-performs the Software industry average of 13%.
View our latest analysis for Xero
Above you can see how the current ROCE for Xero compares to its prior returns on capital, but there's only so much you can tell from the past. If you'd like, you can check out the forecasts from the analysts covering Xero for free.
What Can We Tell From Xero's ROCE Trend?
The fact that Xero is now generating some pre-tax profits from its prior investments is very encouraging. The company was generating losses five years ago, but now it's earning 5.8% which is a sight for sore eyes. And unsurprisingly, like most companies trying to break into the black, Xero is utilizing 189% more capital than it was five years ago. We like this trend, because it tells us the company has profitable reinvestment opportunities available to it, and if it continues going forward that can lead to a multi-bagger performance.
The Bottom Line
Long story short, we're delighted to see that Xero's reinvestment activities have paid off and the company is now profitable. Since the stock has returned a staggering 136% to shareholders over the last five years, it looks like investors are recognizing these changes. So given the stock has proven it has promising trends, it's worth researching the company further to see if these trends are likely to persist.
While Xero looks impressive, no company is worth an infinite price. The intrinsic value infographic for XRO helps visualize whether it is currently trading for a fair price.
If you want to search for solid companies with great earnings, check out this free list of companies with good balance sheets and impressive returns on equity.
Have feedback on this article? Concerned about the content? Get in touch with us directly. Alternatively, email editorial-team (at) simplywallst.com.
This article by Simply Wall St is general in nature. We provide commentary based on historical data and analyst forecasts only using an unbiased methodology and our articles are not intended to be financial advice. It does not constitute a recommendation to buy or sell any stock, and does not take account of your objectives, or your financial situation. We aim to bring you long-term focused analysis driven by fundamental data. Note that our analysis may not factor in the latest price-sensitive company announcements or qualitative material. Simply Wall St has no position in any stocks mentioned.
