
 Yahoo Finance
 Xero (ASX:XRO) Is Experiencing Growth In Returns On Capital
If you're not sure where to start when looking for the next multi-bagger, there are a few key trends you should keep an eye out for. Firstly, we'd want to identify a growing return on capital employed (ROCE) and then alongside that, an ever-increasing base of capital employed. This shows us that it's a compounding machine, able to continually reinvest its earnings back into the business and generate higher returns. With that in mind, we've noticed some promising trends at Xero (ASX:XRO) so let's look a bit deeper.
What is Return On Capital Employed (ROCE)?
Just to clarify if you're unsure, ROCE is a metric for evaluating how much pre-tax income (in percentage terms) a company earns on the capital invested in its business. To calculate this metric for Xero, this is the formula:
Return on Capital Employed = Earnings Before Interest and Tax (EBIT) ÷ (Total Assets - Current Liabilities)
0.01 = NZ$22m ÷ (NZ$2.3b - NZ$164m) (Based on the trailing twelve months to September 2021).
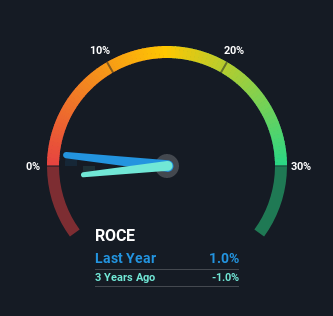
Thus, Xero has an ROCE of 1.0%. In absolute terms, that's a low return and it also under-performs the Software industry average of 11%.
Check out our latest analysis for Xero
Above you can see how the current ROCE for Xero compares to its prior returns on capital, but there's only so much you can tell from the past. If you'd like, you can check out the forecasts from the analysts covering Xero here for free.
The Trend Of ROCE
Xero has recently broken into profitability so their prior investments seem to be paying off. The company was generating losses five years ago, but now it's earning 1.0% which is a sight for sore eyes. In addition to that, Xero is employing 765% more capital than previously which is expected of a company that's trying to break into profitability. This can tell us that the company has plenty of reinvestment opportunities that are able to generate higher returns.
One more thing to note, Xero has decreased current liabilities to 7.2% of total assets over this period, which effectively reduces the amount of funding from suppliers or short-term creditors. So shareholders would be pleased that the growth in returns has mostly come from underlying business performance.
What We Can Learn From Xero's ROCE
In summary, it's great to see that Xero has managed to break into profitability and is continuing to reinvest in its business. Since the stock has returned a staggering 455% to shareholders over the last five years, it looks like investors are recognizing these changes. In light of that, we think it's worth looking further into this stock because if Xero can keep these trends up, it could have a bright future ahead.
If you want to continue researching Xero, you might be interested to know about the 1 warning sign that our analysis has discovered.
While Xero may not currently earn the highest returns, we've compiled a list of companies that currently earn more than 25% return on equity. Check out this free list here.
Have feedback on this article? Concerned about the content? Get in touch with us directly. Alternatively, email editorial-team (at) simplywallst.com.
This article by Simply Wall St is general in nature. We provide commentary based on historical data and analyst forecasts only using an unbiased methodology and our articles are not intended to be financial advice. It does not constitute a recommendation to buy or sell any stock, and does not take account of your objectives, or your financial situation. We aim to bring you long-term focused analysis driven by fundamental data. Note that our analysis may not factor in the latest price-sensitive company announcements or qualitative material. Simply Wall St has no position in any stocks mentioned.
