
 Yahoo Finance
 Wynn Resorts (NASDAQ:WYNN) adds US$363m to market cap in the past 7 days, though investors from three years ago are still down 24%
While not a mind-blowing move, it is good to see that the Wynn Resorts, Limited (NASDAQ:WYNN) share price has gained 17% in the last three months. But that cannot eclipse the less-than-impressive returns over the last three years. After all, the share price is down 25% in the last three years, significantly under-performing the market.
While the stock has risen 3.3% in the past week but long term shareholders are still in the red, let's see what the fundamentals can tell us.
Check out our latest analysis for Wynn Resorts
There is no denying that markets are sometimes efficient, but prices do not always reflect underlying business performance. By comparing earnings per share (EPS) and share price changes over time, we can get a feel for how investor attitudes to a company have morphed over time.
Wynn Resorts became profitable within the last five years. That would generally be considered a positive, so we are surprised to see the share price is down. So given the share price is down it's worth checking some other metrics too.
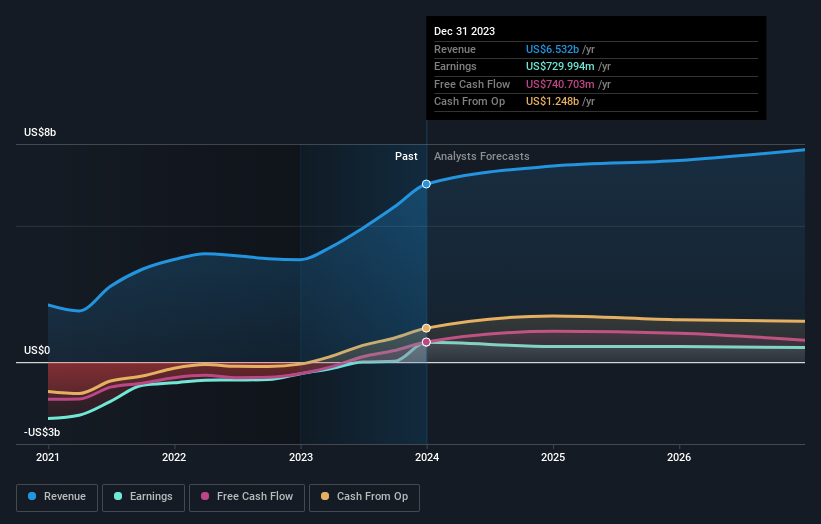
With a rather small yield of just 1.0% we doubt that the stock's share price is based on its dividend. We note that, in three years, revenue has actually grown at a 32% annual rate, so that doesn't seem to be a reason to sell shares. It's probably worth investigating Wynn Resorts further; while we may be missing something on this analysis, there might also be an opportunity.
The graphic below depicts how earnings and revenue have changed over time (unveil the exact values by clicking on the image).
Wynn Resorts is a well known stock, with plenty of analyst coverage, suggesting some visibility into future growth. You can see what analysts are predicting for Wynn Resorts in this interactive graph of future profit estimates.
A Different Perspective
Wynn Resorts shareholders are down 3.9% for the year (even including dividends), but the market itself is up 32%. However, keep in mind that even the best stocks will sometimes underperform the market over a twelve month period. Unfortunately, last year's performance may indicate unresolved challenges, given that it was worse than the annualised loss of 1.7% over the last half decade. We realise that Baron Rothschild has said investors should "buy when there is blood on the streets", but we caution that investors should first be sure they are buying a high quality business. While it is well worth considering the different impacts that market conditions can have on the share price, there are other factors that are even more important. For instance, we've identified 5 warning signs for Wynn Resorts (2 shouldn't be ignored) that you should be aware of.
If you are like me, then you will not want to miss this free list of growing companies that insiders are buying.
Please note, the market returns quoted in this article reflect the market weighted average returns of stocks that currently trade on American exchanges.
Have feedback on this article? Concerned about the content? Get in touch with us directly. Alternatively, email editorial-team (at) simplywallst.com.
This article by Simply Wall St is general in nature. We provide commentary based on historical data and analyst forecasts only using an unbiased methodology and our articles are not intended to be financial advice. It does not constitute a recommendation to buy or sell any stock, and does not take account of your objectives, or your financial situation. We aim to bring you long-term focused analysis driven by fundamental data. Note that our analysis may not factor in the latest price-sensitive company announcements or qualitative material. Simply Wall St has no position in any stocks mentioned.
