
 Yahoo Finance
 WTI Crude Oil Price Forecast: Here We Go Again?
DailyFX.com -
To receive Tyler’s analysis directly via email, please SIGN UP HERE
Talking Points:
Crude Oil Technical Strategy: Favoring Upside > $45.40
WTI Breaks 6 Days of Consecutive Decline Strength, May Resume Uptrend
Sentimental Trading System Shows Upside Signal Remains Strong
A strong technical confluence around $51 per barrel pushed down the price of oil so much that on Thursday, oil was witnessing its biggest weekly drop since April. A new imbalance in the market where demand has begun to outpace supply temporarily has had headlines stirring. However, additional rigs being brought under the market as producers tried to profit from the rising price is naturally limited the upside.
Compete to Win Cash Prizes With Your FXCM Mini Account, Click Here For More Info
We’ve seen volatile fundamentals in the oil market, but the quote currency of oil remains the US dollar. Therefore, traders are encouraged to continue paying attention to the effect of the US Dollar on the price of Oil. Because Oil is priced in US Dollar globally, a stronger Dollar has a deflationary effect on the price of Oil. This effect was at an extreme in late January when the US Dollar was trading at ~14-year highs. However, as the US Dollar begins to fall back toward 2016 lows, we could continue to see further upside in the commodity market as a whole.
Recently, we mentioned an important development in the options market. In short, there were/ are hedge funds and large options traders still favor much more upside. One of the most in-demand options related to Oil right now as per Francisco Blanch, head of commodities research at Bank of America Merrill Lynch in New York is deep out-of-the-money call options, which would only pay out over the coming years if Oil is above $100/bbl. A bullish view indeed and the charts may back that up.
1-Yr Chart of Oil Shows Key Resistance at $51/bbl & $60/bbl
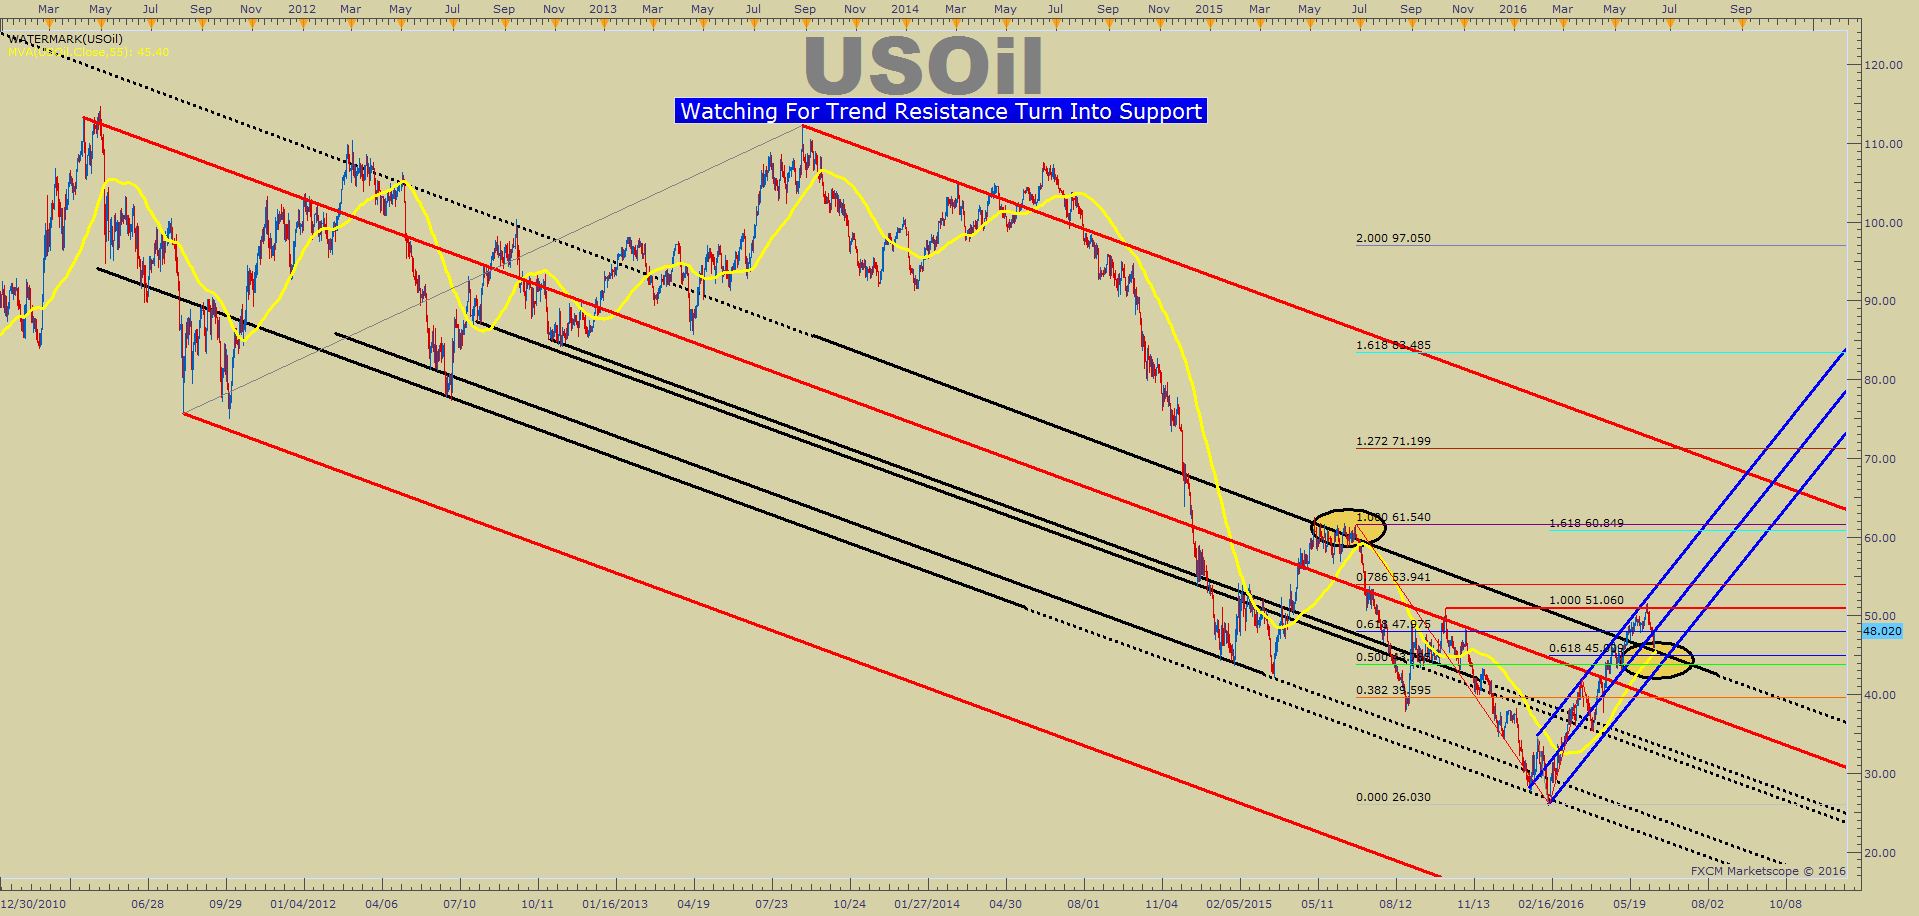
The chart above shows a multi-year downtrend in oil. When looking at trend continuation, naturally you want to see resistance continue to hold. As of Q2 2016, resistance has failed to hold. In addition, we may be seeing the first sign of long-term resistance becoming support. This development on the charts is known as a polarity point where prior resistance turns into new support and is very helpful of new trends developing.
The chart above has highlights where resistance potentially is turned into support and it also aligns with a multitude of support and resistance levels explained in more detail below. For now easier likely for you to look at the 55-Day Moving Average that sits at nearly the same price as the new potential support.
Key Support & Resistance Levels from Here (Visual Map Below)
Traders that have been frustrated by the lack of clear “buying opportunities” in WTI Crude Oil with the rally from mid-February received a gift this week. Since April, we’ve seen very few strong pullbacks until now. As mentioned above, if we can hold above the 55-day moving average, and the US dollar continues to weaken, and we should be on the watch for further levels of resistance breaking and the uptrend resuming back above $50 per barrel.

The 55-Day Moving Average, currently at $45.40/bbl has held as safe support for nearly four months now. If the price can hold this level while resuming the uptrend, it is possible to say this may be the cheapest we see oil for some time.
As of Friday, the weekly loss is still holding, but we’re also holding a support line drawn from the bullish price channel (blue). If we break below this trend line as well as the 55-day moving average, the next level of support would be the lower parallel line of the channel as well as the Ichimoku cloud that currently sits at $43/barrel.
Last Thursday’s high of $51.64 will remain the resistance in focus for now. However, there was a lot of resistance in the $51/bbl region such as the 100% Fibonacci extension move off the February low and the October 2015 higher. Therefore, to see a pullback is not surprising. Furthermore, if we break above the ~$51 resistance level, a stronger break toward the next key resistance level ~$60 could be underway.
Contrarian System Warns of Further Upside As of 6/17/16
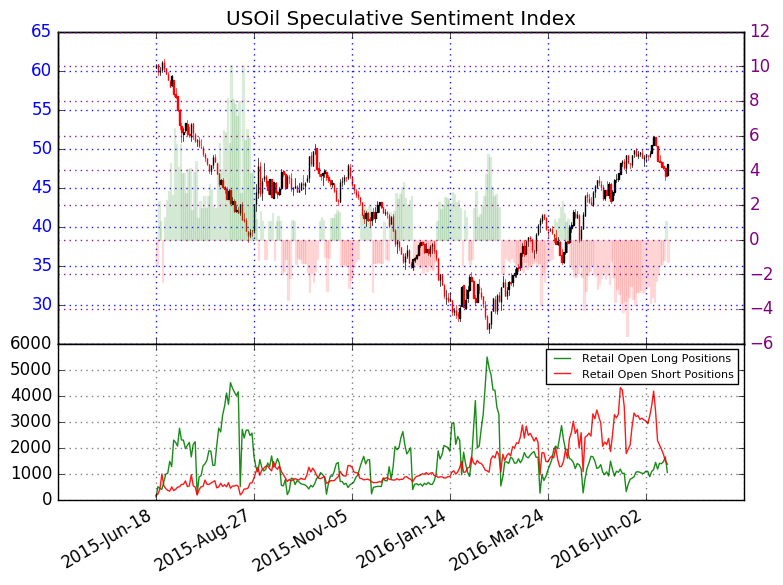
In addition to the technical focus around multiple support-zones, we should keep an eye on retail sentiment, which favors more upside price action. Further upside is currently aligned with our Speculative Sentiment Index or SSI for now.
As of Friday, The ratio of long to short positions in the US Oil stands at -1.30, as 43% of traders are long. Long positions are 34.8% lower than yesterday and 13.8% below levels seen last week. Short positions are 10.0% lower than yesterday and 41.1% below levels seen last week. Open interest is 22.8% lower than yesterday and 37.6% below its monthly average. We use our SSI as a contrarian indicator to price action, and the fact that the majority of traders are short gives a signal that the USOil may continue higher. The trading crowd has flipped from net-long to net-short from yesterday but unchanged since last week.
Key Levels Over the Next 48-hrs As of Friday, June 17, 2016

T.Y.
Think Oil has more room to run? Trade Oil With Low Margin Requirements (non-US Residents only)
DailyFX provides forex news and technical analysis on the trends that influence the global currency markets.
Learn forex trading with a free practice account and trading charts from FXCM.
