
 Yahoo Finance
 WTI Crude Oil Price Forecast: Bear Market Below 200-DMA
DailyFX.com -
To receive Tyler’s analysis directly via email, please SIGN UP HERE
Talking Points:
Crude Oil Technical Strategy: Favoring Downside < $45.81/bbl
Ichimoku Preceded 200-DMA In Favoring Price Breakdown
Sentimental Trading System Weekly Long Exposure Increased 80.8%
Access Our Free Q3 Oil Outlook As Oil's Best Quarter Looks For Confirmation
The price of WTI Crude Oil (CFD: USOil) traded at its lowest levels in three months to open the month of August. The Crude Oil rally looks to be diverging from the equity rally that saw SPX500 reach lifetime highs intraday on Monday. We have recently shared in previous weeks that there is a developing story of worrying increases of over-supply, which was the main culprit of the 2014-2016 fall.
Track short-term Crude Oil price levels and patterns with the GSI indicator!
For this reason, we have encouraged you to keep an eye on increasing supply in H2 2016, and whether or not supply will be met with sufficient demand. Two fundamental readings to keep an eye on is the DOE US Inventory Reports on Wednesday and the Baker Hughes Rig Count on Friday afternoons. Both of these announcements are helpful to see if oversupply is accelerating or not.
Over July, we appeared to be seeing a new wave of supply coming onto the market, and if demand cannot keep up (which the storage on Oil tankers argues it cannot), we could move lower. To explain how much lower we can look in August, let’s move on to the charts.
Crude Oil Price Chart Shows Path of Least Resistance Is Lower Toward Fibonacci Support

There are a lot of things that should catch your attention on the chart, but none more than the 200-DMA. The 200-DMA currently at $40.47/bbl has been a clear indicator of Oil strength or weakness going back to 2014. With Monday’s break of the price of Oil below the 200-DMA, few things are going right for Crude Oil Bulls when looking at the price chart.
Ichimoku Cloud is a trend following indicator that allows you to see the “big-picture trend” on the chart. If price (shown via candles), and the momentum line (bright green on my chart) are below the cloud, we are in a bearish environment. Buying against the momentum and trend is not advised because a downtrend tends to gather steam much like a snowball rolling down a mountain. Additionally, the Bearish Channel also is framing price action nicely. That being said, only a break back above the 200-DMA as well as the Bearish Price Channel should encourage traders to think they downside move may be resting or at best, is over.
Significant support aligns at the 61.8% Fibonacci Retracement zone of the February-June zone, which is also the late-March low ~$35.81/bbl. While fighting a trend is not encouraged, that is a level to see if buyers begin to show up due to bargain prices.
Bottom Line:
The question has now become whether or not we’re on the verge of a new break-down in Oil. A few macro signals say this likely isn’t the case, but the bear case remains firmly entrenched for now. Given the lack of Dollar strength, any strength in USD would favor downside acceleration in the price of Crude Oil. Furthermore, now that we’ve broken below the 200-DMA, a stronger break toward the next key support of 50% of the February-June range at $38.835/bbl could be underway.
For now, the big risk appears to be a resumption of US Dollar strength that would continue to pressure the price of Oil down through the50%-61.8% retracement zone of the February-June rally.
Contrarian System Warns of Further Downside As of 8/01/16
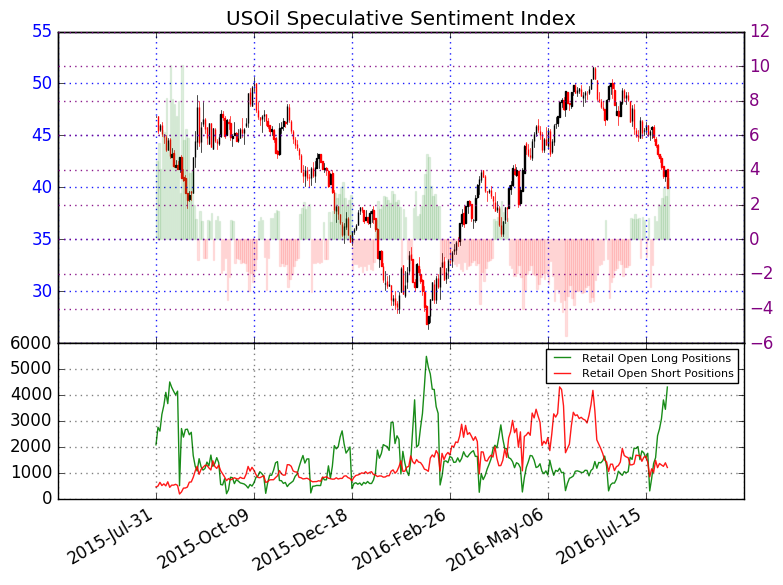
In addition to the technical focus around multiple support-zones, we should keep an eye on retail sentiment. Further downside is currently alignedwith our Speculative Sentiment Index or SSIfor now.
As of mid-day Thursday, The ratio of long to short positions in the USOil stands at 3.56 as 78% of traders are long. Long positions are 20.6% higher than yesterday and 80.8% above levels seen last week.Short positions are 5.6% lower than yesterday and 2.3% below levels seen last week. Open interest is 13.7% higher than yesterday and 62.1% above its monthly average
We use our SSI as a contrarian indicator to price action, and the fact that the majority of traders are long gives signal that the USOil may continue lower. The trading crowd has grown further net-long from yesterday and last week. The combination of current sentiment and recent changes gives a further bearish trading bias.
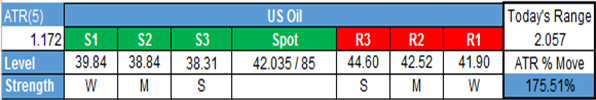
Key Levels Over the Next 48-hrs of Trading As of Monday, August 1, 2016
T.Y.
Think Oil has more room to run? Trade Oil With Low Margin Requirements (non-US Residents only)
DailyFX provides forex news and technical analysis on the trends that influence the global currency markets.
Learn forex trading with a free practice account and trading charts from FXCM.
