
 Yahoo Finance
 Should We Worry About Suncor Energy Inc.'s (TSE:SU) P/E Ratio?

The goal of this article is to teach you how to use price to earnings ratios (P/E ratios). We'll show how you can use Suncor Energy Inc.'s (TSE:SU) P/E ratio to inform your assessment of the investment opportunity. What is Suncor Energy's P/E ratio? Well, based on the last twelve months it is 13.66. That means that at current prices, buyers pay CA$13.66 for every CA$1 in trailing yearly profits.
View our latest analysis for Suncor Energy
How Do You Calculate Suncor Energy's P/E Ratio?
The formula for price to earnings is:
Price to Earnings Ratio = Share Price ÷ Earnings per Share (EPS)
Or for Suncor Energy:
P/E of 13.66 = CAD43.00 ÷ CAD3.15 (Based on the trailing twelve months to September 2019.)
Is A High P/E Ratio Good?
A higher P/E ratio implies that investors pay a higher price for the earning power of the business. That isn't a good or a bad thing on its own, but a high P/E means that buyers have a higher opinion of the business's prospects, relative to stocks with a lower P/E.
How Does Suncor Energy's P/E Ratio Compare To Its Peers?
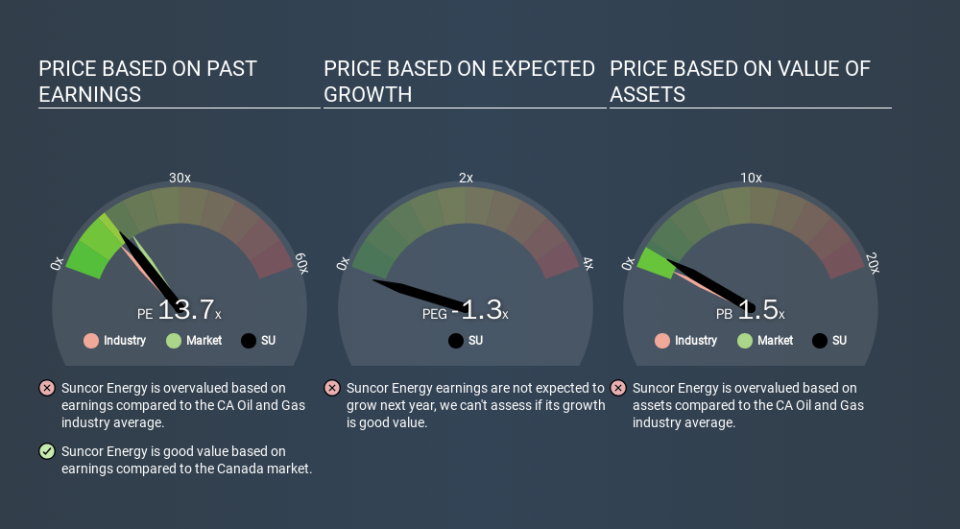
The P/E ratio essentially measures market expectations of a company. You can see in the image below that the average P/E (11.5) for companies in the oil and gas industry is lower than Suncor Energy's P/E.
That means that the market expects Suncor Energy will outperform other companies in its industry. The market is optimistic about the future, but that doesn't guarantee future growth. So investors should delve deeper. I like to check if company insiders have been buying or selling.
How Growth Rates Impact P/E Ratios
Probably the most important factor in determining what P/E a company trades on is the earnings growth. That's because companies that grow earnings per share quickly will rapidly increase the 'E' in the equation. And in that case, the P/E ratio itself will drop rather quickly. A lower P/E should indicate the stock is cheap relative to others -- and that may attract buyers.
Suncor Energy saw earnings per share improve by -3.9% last year. And its annual EPS growth rate over 5 years is 8.6%.
Don't Forget: The P/E Does Not Account For Debt or Bank Deposits
One drawback of using a P/E ratio is that it considers market capitalization, but not the balance sheet. That means it doesn't take debt or cash into account. In theory, a company can lower its future P/E ratio by using cash or debt to invest in growth.
Such expenditure might be good or bad, in the long term, but the point here is that the balance sheet is not reflected by this ratio.
Suncor Energy's Balance Sheet
Suncor Energy has net debt worth 19% of its market capitalization. This could bring some additional risk, and reduce the number of investment options for management; worth remembering if you compare its P/E to businesses without debt.
The Bottom Line On Suncor Energy's P/E Ratio
Suncor Energy trades on a P/E ratio of 13.7, which is below the CA market average of 15.9. The company hasn't stretched its balance sheet, and earnings are improving. The P/E ratio implies the market is cautious about longer term prospects.
When the market is wrong about a stock, it gives savvy investors an opportunity. If it is underestimating a company, investors can make money by buying and holding the shares until the market corrects itself. So this free report on the analyst consensus forecasts could help you make a master move on this stock.
Of course, you might find a fantastic investment by looking at a few good candidates. So take a peek at this free list of companies with modest (or no) debt, trading on a P/E below 20.
If you spot an error that warrants correction, please contact the editor at editorial-team@simplywallst.com. This article by Simply Wall St is general in nature. It does not constitute a recommendation to buy or sell any stock, and does not take account of your objectives, or your financial situation. Simply Wall St has no position in the stocks mentioned.
We aim to bring you long-term focused research analysis driven by fundamental data. Note that our analysis may not factor in the latest price-sensitive company announcements or qualitative material. Thank you for reading.
