
 Yahoo Finance
 Should You Worry About Starpharma Holdings Limited's (ASX:SPL) CEO Pay Cheque?

In 2006 Jackie Fairley was appointed CEO of Starpharma Holdings Limited (ASX:SPL). This analysis aims first to contrast CEO compensation with other companies that have similar market capitalization. Next, we'll consider growth that the business demonstrates. And finally we will reflect on how common stockholders have fared in the last few years, as a secondary measure of performance. This method should give us information to assess how appropriately the company pays the CEO.
See our latest analysis for Starpharma Holdings
How Does Jackie Fairley's Compensation Compare With Similar Sized Companies?
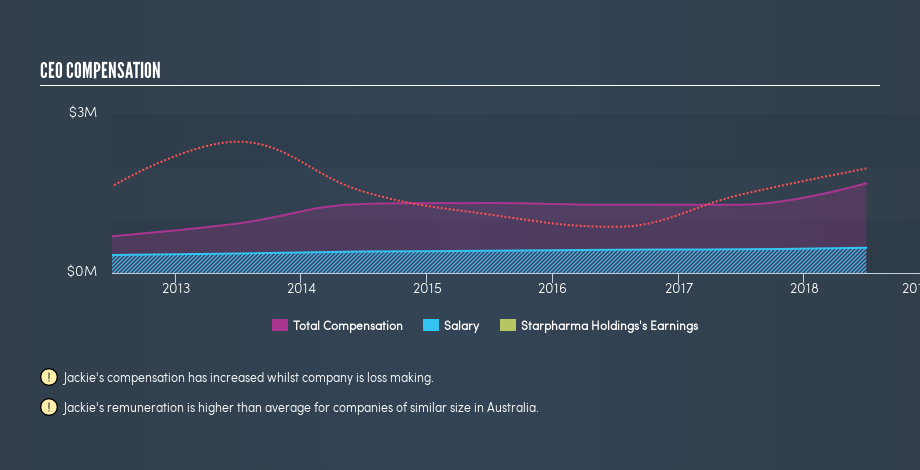
Our data indicates that Starpharma Holdings Limited is worth AU$465m, and total annual CEO compensation is AU$1.7m. (This number is for the twelve months until June 2018). We think total compensation is more important but we note that the CEO salary is lower, at AU$475k. We looked at a group of companies with market capitalizations from AU$279m to AU$1.1b, and the median CEO total compensation was AU$1.0m.
As you can see, Jackie Fairley is paid more than the median CEO pay at companies of a similar size, in the same market. However, this does not necessarily mean Starpharma Holdings Limited is paying too much. A closer look at the performance of the underlying business will give us a better idea about whether the pay is particularly generous.
You can see a visual representation of the CEO compensation at Starpharma Holdings, below.
Is Starpharma Holdings Limited Growing?
Over the last three years Starpharma Holdings Limited has grown its earnings per share (EPS) by an average of 31% per year (using a line of best fit). The trailing twelve months of revenue was pretty much the same as the prior period.
Overall this is a positive result for shareholders, showing that the company has improved in recent years. It's also good to see modest revenue growth, suggesting the underlying business is healthy. You might want to check this free visual report on analyst forecasts for future earnings.
Has Starpharma Holdings Limited Been A Good Investment?
I think that the total shareholder return of 89%, over three years, would leave most Starpharma Holdings Limited shareholders smiling. As a result, some may believe the CEO should be paid more than is normal for companies of similar size.
In Summary...
We compared the total CEO remuneration paid by Starpharma Holdings Limited, and compared it to remuneration at a group of similar sized companies. As discussed above, we discovered that the company pays more than the median of that group.
However we must not forget that the EPS growth has been very strong over three years. On top of that, in the same period, returns to shareholders have been great. Considering this fine result for shareholders, we daresay the CEO compensation might be apt. So you may want to check if insiders are buying Starpharma Holdings shares with their own money (free access).
If you want to buy a stock that is better than Starpharma Holdings, this free list of high return, low debt companies is a great place to look.
We aim to bring you long-term focused research analysis driven by fundamental data. Note that our analysis may not factor in the latest price-sensitive company announcements or qualitative material.
If you spot an error that warrants correction, please contact the editor at editorial-team@simplywallst.com. This article by Simply Wall St is general in nature. It does not constitute a recommendation to buy or sell any stock, and does not take account of your objectives, or your financial situation. Simply Wall St has no position in the stocks mentioned. Thank you for reading.
