
 Yahoo Finance
 Should You Worry About Kaman Corporation's (NYSE:KAMN) CEO Pay?

Want to participate in a short research study? Help shape the future of investing tools and you could win a $250 gift card!
Neal Keating has been the CEO of Kaman Corporation (NYSE:KAMN) since 2008. This report will, first, examine the CEO compensation levels in comparison to CEO compensation at companies of similar size. Then we'll look at a snap shot of the business growth. And finally - as a second measure of performance - we will look at the returns shareholders have received over the last few years. This method should give us information to assess how appropriately the company pays the CEO.
See our latest analysis for Kaman
How Does Neal Keating's Compensation Compare With Similar Sized Companies?
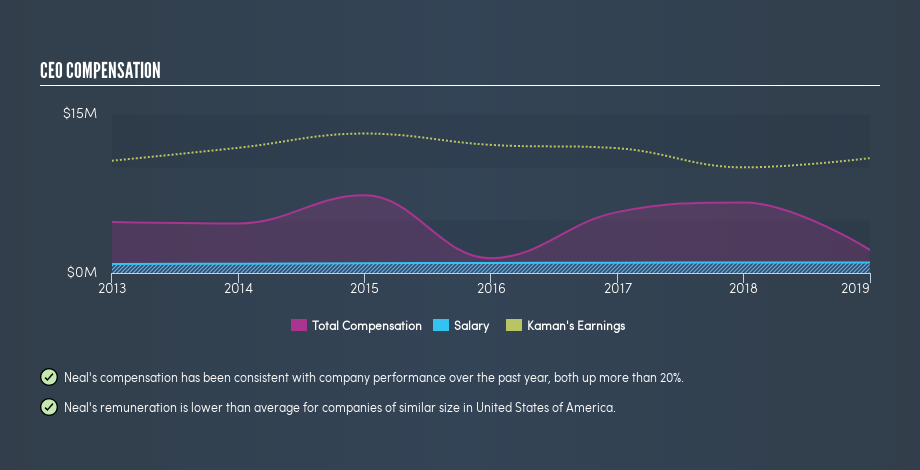
Our data indicates that Kaman Corporation is worth US$1.8b, and total annual CEO compensation is US$2.2m. (This is based on the year to December 2018). While we always look at total compensation first, we note that the salary component is less, at US$1.0m. We examined companies with market caps from US$1.0b to US$3.2b, and discovered that the median CEO total compensation of that group was US$4.0m.
Most shareholders would consider it a positive that Neal Keating takes less total compensation than the CEOs of most similar size companies, leaving more for shareholders. While this is a good thing, you'll need to understand the business better before you can form an opinion.
The graphic below shows how CEO compensation at Kaman has changed from year to year.
Is Kaman Corporation Growing?
Over the last three years Kaman Corporation has shrunk its earnings per share by an average of 2.9% per year (measured with a line of best fit). Its revenue is up 2.0% over last year.
Unfortunately there is a complete lack of earnings per share improvement, over three years. The modest increase in revenue in the last year isn't enough to make me overlook the disappointing change in earnings per share. So given this relatively weak performance, shareholders would probably not want to see high compensation for the CEO. It could be important to check this free visual depiction of what analysts expect for the future.
Has Kaman Corporation Been A Good Investment?
Most shareholders would probably be pleased with Kaman Corporation for providing a total return of 56% over three years. As a result, some may believe the CEO should be paid more than is normal for companies of similar size.
In Summary...
Kaman Corporation is currently paying its CEO below what is normal for companies of its size.
Neal Keating is paid less than CEOs of similar size companies. While the company isn't growing on our analysis, shareholder returns have been good in recent years. Although we could see higher EPS growth, we'd argue the remuneration is not an issue, based on these observations. Whatever your view on compensation, you might want to check if insiders are buying or selling Kaman shares (free trial).
Of course, you might find a fantastic investment by looking elsewhere. So take a peek at this free list of interesting companies.
We aim to bring you long-term focused research analysis driven by fundamental data. Note that our analysis may not factor in the latest price-sensitive company announcements or qualitative material.
If you spot an error that warrants correction, please contact the editor at editorial-team@simplywallst.com. This article by Simply Wall St is general in nature. It does not constitute a recommendation to buy or sell any stock, and does not take account of your objectives, or your financial situation. Simply Wall St has no position in the stocks mentioned. Thank you for reading.
