
 Yahoo Finance
 World Fuel Services Corporation's (NYSE:INT) Intrinsic Value Is Potentially 61% Above Its Share Price
Key Insights
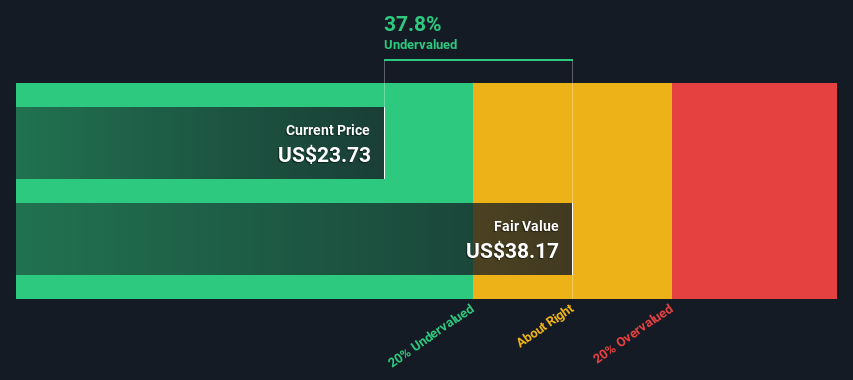
The projected fair value for World Fuel Services is US$38.17 based on 2 Stage Free Cash Flow to Equity
Current share price of US$23.73 suggests World Fuel Services is potentially 38% undervalued
Does the March share price for World Fuel Services Corporation (NYSE:INT) reflect what it's really worth? Today, we will estimate the stock's intrinsic value by taking the expected future cash flows and discounting them to their present value. We will take advantage of the Discounted Cash Flow (DCF) model for this purpose. Before you think you won't be able to understand it, just read on! It's actually much less complex than you'd imagine.
Companies can be valued in a lot of ways, so we would point out that a DCF is not perfect for every situation. For those who are keen learners of equity analysis, the Simply Wall St analysis model here may be something of interest to you.
View our latest analysis for World Fuel Services
The Model
We use what is known as a 2-stage model, which simply means we have two different periods of growth rates for the company's cash flows. Generally the first stage is higher growth, and the second stage is a lower growth phase. In the first stage we need to estimate the cash flows to the business over the next ten years. Where possible we use analyst estimates, but when these aren't available we extrapolate the previous free cash flow (FCF) from the last estimate or reported value. We assume companies with shrinking free cash flow will slow their rate of shrinkage, and that companies with growing free cash flow will see their growth rate slow, over this period. We do this to reflect that growth tends to slow more in the early years than it does in later years.
Generally we assume that a dollar today is more valuable than a dollar in the future, so we discount the value of these future cash flows to their estimated value in today's dollars:
10-year free cash flow (FCF) forecast
2023 | 2024 | 2025 | 2026 | 2027 | 2028 | 2029 | 2030 | 2031 | 2032 | |
Levered FCF ($, Millions) | US$180.4m | US$194.4m | US$213.2m | US$227.2m | US$239.0m | US$249.3m | US$258.3m | US$266.4m | US$273.9m | US$281.0m |
Growth Rate Estimate Source | Analyst x1 | Analyst x1 | Analyst x1 | Est @ 6.57% | Est @ 5.22% | Est @ 4.27% | Est @ 3.61% | Est @ 3.15% | Est @ 2.83% | Est @ 2.60% |
Present Value ($, Millions) Discounted @ 11% | US$162 | US$157 | US$154 | US$148 | US$139 | US$130 | US$121 | US$112 | US$104 | US$95.5 |
("Est" = FCF growth rate estimated by Simply Wall St)
Present Value of 10-year Cash Flow (PVCF) = US$1.3b
We now need to calculate the Terminal Value, which accounts for all the future cash flows after this ten year period. For a number of reasons a very conservative growth rate is used that cannot exceed that of a country's GDP growth. In this case we have used the 5-year average of the 10-year government bond yield (2.1%) to estimate future growth. In the same way as with the 10-year 'growth' period, we discount future cash flows to today's value, using a cost of equity of 11%.
Terminal Value (TV)= FCF2032 × (1 + g) ÷ (r – g) = US$281m× (1 + 2.1%) ÷ (11%– 2.1%) = US$3.1b
Present Value of Terminal Value (PVTV)= TV / (1 + r)10= US$3.1b÷ ( 1 + 11%)10= US$1.0b
The total value is the sum of cash flows for the next ten years plus the discounted terminal value, which results in the Total Equity Value, which in this case is US$2.4b. To get the intrinsic value per share, we divide this by the total number of shares outstanding. Relative to the current share price of US$23.7, the company appears quite undervalued at a 38% discount to where the stock price trades currently. The assumptions in any calculation have a big impact on the valuation, so it is better to view this as a rough estimate, not precise down to the last cent.
Important Assumptions
The calculation above is very dependent on two assumptions. The first is the discount rate and the other is the cash flows. If you don't agree with these result, have a go at the calculation yourself and play with the assumptions. The DCF also does not consider the possible cyclicality of an industry, or a company's future capital requirements, so it does not give a full picture of a company's potential performance. Given that we are looking at World Fuel Services as potential shareholders, the cost of equity is used as the discount rate, rather than the cost of capital (or weighted average cost of capital, WACC) which accounts for debt. In this calculation we've used 11%, which is based on a levered beta of 1.570. Beta is a measure of a stock's volatility, compared to the market as a whole. We get our beta from the industry average beta of globally comparable companies, with an imposed limit between 0.8 and 2.0, which is a reasonable range for a stable business.
SWOT Analysis for World Fuel Services
Strength
Earnings growth over the past year exceeded its 5-year average.
Net debt to equity ratio below 40%.
Dividends are covered by earnings and cash flows.
Weakness
Earnings growth over the past year underperformed the Oil and Gas industry.
Interest payments on debt are not well covered.
Dividend is low compared to the top 25% of dividend payers in the Oil and Gas market.
Opportunity
Annual earnings are forecast to grow for the next 2 years.
Trading below our estimate of fair value by more than 20%.
Threat
Debt is not well covered by operating cash flow.
Moving On:
Whilst important, the DCF calculation is only one of many factors that you need to assess for a company. It's not possible to obtain a foolproof valuation with a DCF model. Rather it should be seen as a guide to "what assumptions need to be true for this stock to be under/overvalued?" If a company grows at a different rate, or if its cost of equity or risk free rate changes sharply, the output can look very different. Why is the intrinsic value higher than the current share price? For World Fuel Services, we've compiled three relevant factors you should further examine:
Financial Health: Does INT have a healthy balance sheet? Take a look at our free balance sheet analysis with six simple checks on key factors like leverage and risk.
Future Earnings: How does INT's growth rate compare to its peers and the wider market? Dig deeper into the analyst consensus number for the upcoming years by interacting with our free analyst growth expectation chart.
Other High Quality Alternatives: Do you like a good all-rounder? Explore our interactive list of high quality stocks to get an idea of what else is out there you may be missing!
PS. Simply Wall St updates its DCF calculation for every American stock every day, so if you want to find the intrinsic value of any other stock just search here.
Have feedback on this article? Concerned about the content? Get in touch with us directly. Alternatively, email editorial-team (at) simplywallst.com.
This article by Simply Wall St is general in nature. We provide commentary based on historical data and analyst forecasts only using an unbiased methodology and our articles are not intended to be financial advice. It does not constitute a recommendation to buy or sell any stock, and does not take account of your objectives, or your financial situation. We aim to bring you long-term focused analysis driven by fundamental data. Note that our analysis may not factor in the latest price-sensitive company announcements or qualitative material. Simply Wall St has no position in any stocks mentioned.
Join A Paid User Research Session
You’ll receive a US$30 Amazon Gift card for 1 hour of your time while helping us build better investing tools for the individual investors like yourself. Sign up here
