
 Yahoo Finance
 Wiseway Group (ASX:WWG) Is Reinvesting At Lower Rates Of Return
Did you know there are some financial metrics that can provide clues of a potential multi-bagger? Typically, we'll want to notice a trend of growing return on capital employed (ROCE) and alongside that, an expanding base of capital employed. This shows us that it's a compounding machine, able to continually reinvest its earnings back into the business and generate higher returns. Although, when we looked at Wiseway Group (ASX:WWG), it didn't seem to tick all of these boxes.
Return On Capital Employed (ROCE): What Is It?
For those that aren't sure what ROCE is, it measures the amount of pre-tax profits a company can generate from the capital employed in its business. To calculate this metric for Wiseway Group, this is the formula:
Return on Capital Employed = Earnings Before Interest and Tax (EBIT) ÷ (Total Assets - Current Liabilities)
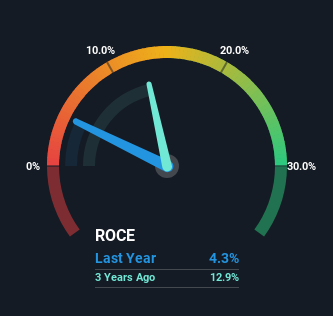
0.043 = AU$2.1m ÷ (AU$67m - AU$19m) (Based on the trailing twelve months to December 2023).
Thus, Wiseway Group has an ROCE of 4.3%. In absolute terms, that's a low return and it also under-performs the Logistics industry average of 11%.
See our latest analysis for Wiseway Group
While the past is not representative of the future, it can be helpful to know how a company has performed historically, which is why we have this chart above. If you're interested in investigating Wiseway Group's past further, check out this free graph covering Wiseway Group's past earnings, revenue and cash flow.
The Trend Of ROCE
In terms of Wiseway Group's historical ROCE movements, the trend isn't fantastic. Around five years ago the returns on capital were 6.8%, but since then they've fallen to 4.3%. On the other hand, the company has been employing more capital without a corresponding improvement in sales in the last year, which could suggest these investments are longer term plays. It's worth keeping an eye on the company's earnings from here on to see if these investments do end up contributing to the bottom line.
On a side note, Wiseway Group has done well to pay down its current liabilities to 28% of total assets. So we could link some of this to the decrease in ROCE. What's more, this can reduce some aspects of risk to the business because now the company's suppliers or short-term creditors are funding less of its operations. Since the business is basically funding more of its operations with it's own money, you could argue this has made the business less efficient at generating ROCE.
What We Can Learn From Wiseway Group's ROCE
In summary, Wiseway Group is reinvesting funds back into the business for growth but unfortunately it looks like sales haven't increased much just yet. Moreover, since the stock has crumbled 88% over the last five years, it appears investors are expecting the worst. In any case, the stock doesn't have these traits of a multi-bagger discussed above, so if that's what you're looking for, we think you'd have more luck elsewhere.
Like most companies, Wiseway Group does come with some risks, and we've found 3 warning signs that you should be aware of.
While Wiseway Group may not currently earn the highest returns, we've compiled a list of companies that currently earn more than 25% return on equity. Check out this free list here.
Have feedback on this article? Concerned about the content? Get in touch with us directly. Alternatively, email editorial-team (at) simplywallst.com.
This article by Simply Wall St is general in nature. We provide commentary based on historical data and analyst forecasts only using an unbiased methodology and our articles are not intended to be financial advice. It does not constitute a recommendation to buy or sell any stock, and does not take account of your objectives, or your financial situation. We aim to bring you long-term focused analysis driven by fundamental data. Note that our analysis may not factor in the latest price-sensitive company announcements or qualitative material. Simply Wall St has no position in any stocks mentioned.
