
 Yahoo Finance
 Why SPS Commerce, Inc.'s (NASDAQ:SPSC) CEO Pay Matters To You

Archie Black became the CEO of SPS Commerce, Inc. (NASDAQ:SPSC) in 2001. This report will, first, examine the CEO compensation levels in comparison to CEO compensation at companies of similar size. Next, we'll consider growth that the business demonstrates. Third, we'll reflect on the total return to shareholders over three years, as a second measure of business performance. This method should give us information to assess how appropriately the company pays the CEO.
Check out our latest analysis for SPS Commerce
How Does Archie Black's Compensation Compare With Similar Sized Companies?
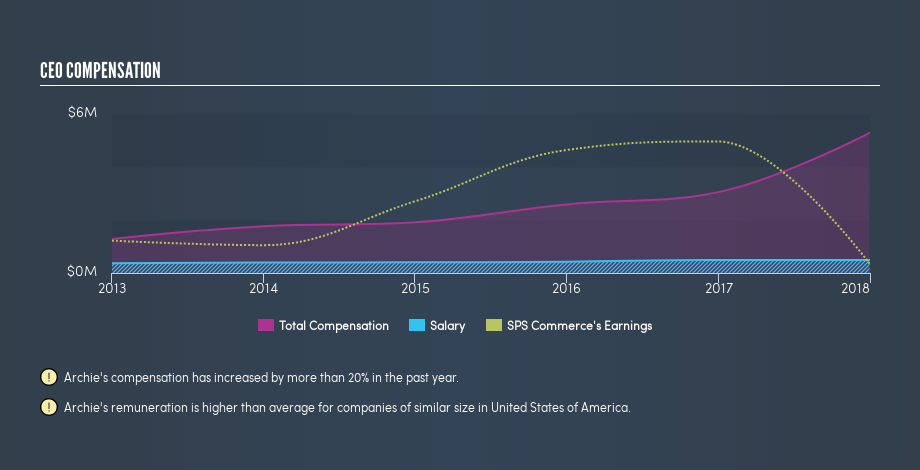
According to our data, SPS Commerce, Inc. has a market capitalization of US$1.8b, and pays its CEO total annual compensation worth US$5.3m. (This is based on the year to December 2017). While we always look at total compensation first, we note that the salary component is less, at US$495k. When we examined a selection of companies with market caps ranging from US$1.0b to US$3.2b, we found the median CEO total compensation was US$3.7m.
Thus we can conclude that Archie Black receives more in total compensation than the median of a group of companies in the same market, and of similar size to SPS Commerce, Inc.. However, this doesn't necessarily mean the pay is too high. We can get a better idea of how generous the pay is by looking at the performance of the underlying business.
The graphic below shows how CEO compensation at SPS Commerce has changed from year to year.
Is SPS Commerce, Inc. Growing?
On average over the last three years, SPS Commerce, Inc. has grown earnings per share (EPS) by 25% each year (using a line of best fit). In the last year, its revenue is up 13%.
This demonstrates that the company has been improving recently. A good result. It's also good to see decent revenue growth in the last year, suggesting the business is healthy and growing. Shareholders might be interested in this free visualization of analyst forecasts.
Has SPS Commerce, Inc. Been A Good Investment?
I think that the total shareholder return of 108%, over three years, would leave most SPS Commerce, Inc. shareholders smiling. This strong performance might mean some shareholders don't mind if the CEO were to be paid more than is normal for a company of its size.
In Summary...
We compared the total CEO remuneration paid by SPS Commerce, Inc., and compared it to remuneration at a group of similar sized companies. As discussed above, we discovered that the company pays more than the median of that group.
Importantly, though, the company has impressed with its earnings per share growth, over three years. In addition, shareholders have done well over the same time period. So, considering this good performance, the CEO compensation may be quite appropriate. CEO compensation is one thing, but it is also interesting to check if the CEO is buying or selling SPS Commerce (free visualization of insider trades).
If you want to buy a stock that is better than SPS Commerce, this free list of high return, low debt companies is a great place to look.
We aim to bring you long-term focused research analysis driven by fundamental data. Note that our analysis may not factor in the latest price-sensitive company announcements or qualitative material.
If you spot an error that warrants correction, please contact the editor at editorial-team@simplywallst.com. This article by Simply Wall St is general in nature. It does not constitute a recommendation to buy or sell any stock, and does not take account of your objectives, or your financial situation. Simply Wall St has no position in the stocks mentioned. Thank you for reading.
