
 Yahoo Finance
 Why We Like Base Resources Limited’s (ASX:BSE) 16% Return On Capital Employed

Today we are going to look at Base Resources Limited (ASX:BSE) to see whether it might be an attractive investment prospect. Specifically, we're going to calculate its Return On Capital Employed (ROCE), in the hopes of getting some insight into the business.
First up, we'll look at what ROCE is and how we calculate it. Second, we'll look at its ROCE compared to similar companies. Finally, we'll look at how its current liabilities affect its ROCE.
What is Return On Capital Employed (ROCE)?
ROCE measures the 'return' (pre-tax profit) a company generates from capital employed in its business. In general, businesses with a higher ROCE are usually better quality. Overall, it is a valuable metric that has its flaws. Author Edwin Whiting says to be careful when comparing the ROCE of different businesses, since 'No two businesses are exactly alike.
So, How Do We Calculate ROCE?
The formula for calculating the return on capital employed is:
Return on Capital Employed = Earnings Before Interest and Tax (EBIT) ÷ (Total Assets - Current Liabilities)
Or for Base Resources:
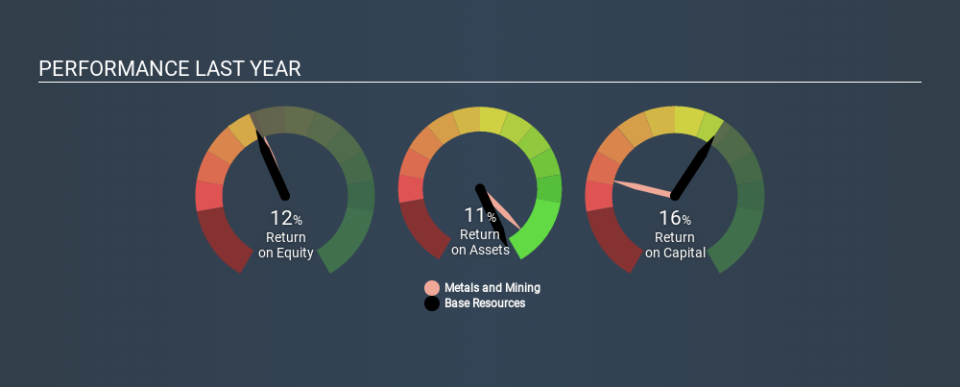
0.16 = US$61m ÷ (US$449m - US$69m) (Based on the trailing twelve months to June 2019.)
Therefore, Base Resources has an ROCE of 16%.
Check out our latest analysis for Base Resources
Is Base Resources's ROCE Good?
When making comparisons between similar businesses, investors may find ROCE useful. Using our data, we find that Base Resources's ROCE is meaningfully better than the 8.2% average in the Metals and Mining industry. We consider this a positive sign, because it suggests it uses capital more efficiently than similar companies. Independently of how Base Resources compares to its industry, its ROCE in absolute terms appears decent, and the company may be worthy of closer investigation.
We can see that, Base Resources currently has an ROCE of 16% compared to its ROCE 3 years ago, which was 2.8%. This makes us think about whether the company has been reinvesting shrewdly. You can see in the image below how Base Resources's ROCE compares to its industry. Click to see more on past growth.
When considering this metric, keep in mind that it is backwards looking, and not necessarily predictive. ROCE can be deceptive for cyclical businesses, as returns can look incredible in boom times, and terribly low in downturns. ROCE is, after all, simply a snap shot of a single year. Given the industry it operates in, Base Resources could be considered cyclical. What happens in the future is pretty important for investors, so we have prepared a free report on analyst forecasts for Base Resources.
Base Resources's Current Liabilities And Their Impact On Its ROCE
Current liabilities are short term bills and invoices that need to be paid in 12 months or less. Due to the way the ROCE equation works, having large bills due in the near term can make it look as though a company has less capital employed, and thus a higher ROCE than usual. To counteract this, we check if a company has high current liabilities, relative to its total assets.
Base Resources has total assets of US$449m and current liabilities of US$69m. As a result, its current liabilities are equal to approximately 15% of its total assets. Current liabilities are minimal, limiting the impact on ROCE.
The Bottom Line On Base Resources's ROCE
This is good to see, and with a sound ROCE, Base Resources could be worth a closer look. Base Resources looks strong on this analysis, but there are plenty of other companies that could be a good opportunity . Here is a free list of companies growing earnings rapidly.
I will like Base Resources better if I see some big insider buys. While we wait, check out this free list of growing companies with considerable, recent, insider buying.
If you spot an error that warrants correction, please contact the editor at editorial-team@simplywallst.com. This article by Simply Wall St is general in nature. It does not constitute a recommendation to buy or sell any stock, and does not take account of your objectives, or your financial situation. Simply Wall St has no position in the stocks mentioned.
We aim to bring you long-term focused research analysis driven by fundamental data. Note that our analysis may not factor in the latest price-sensitive company announcements or qualitative material. Thank you for reading.
