
 Yahoo Finance
 Why We’re Not Keen On GUD Holdings Limited’s (ASX:GUD) 20% Return On Capital

Today we are going to look at GUD Holdings Limited (ASX:GUD) to see whether it might be an attractive investment prospect. Specifically, we're going to calculate its Return On Capital Employed (ROCE), in the hopes of getting some insight into the business.
First up, we'll look at what ROCE is and how we calculate it. Second, we'll look at its ROCE compared to similar companies. Finally, we'll look at how its current liabilities affect its ROCE.
Understanding Return On Capital Employed (ROCE)
ROCE is a metric for evaluating how much pre-tax income (in percentage terms) a company earns on the capital invested in its business. All else being equal, a better business will have a higher ROCE. In brief, it is a useful tool, but it is not without drawbacks. Author Edwin Whiting says to be careful when comparing the ROCE of different businesses, since 'No two businesses are exactly alike.
So, How Do We Calculate ROCE?
Analysts use this formula to calculate return on capital employed:
Return on Capital Employed = Earnings Before Interest and Tax (EBIT) ÷ (Total Assets - Current Liabilities)
Or for GUD Holdings:
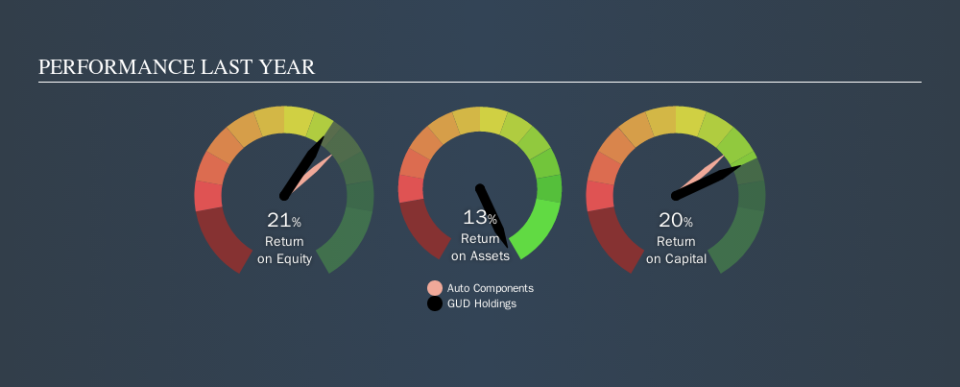
0.20 = AU$87m ÷ (AU$526m - AU$86m) (Based on the trailing twelve months to June 2019.)
Therefore, GUD Holdings has an ROCE of 20%.
See our latest analysis for GUD Holdings
Is GUD Holdings's ROCE Good?
ROCE can be useful when making comparisons, such as between similar companies. We can see GUD Holdings's ROCE is meaningfully below the Auto Components industry average of 27%. This performance could be negative if sustained, as it suggests the business may underperform its industry. Regardless of where GUD Holdings sits next to its industry, its ROCE in absolute terms appears satisfactory, and this company could be worth a closer look.
The image below shows how GUD Holdings's ROCE compares to its industry, and you can click it to see more detail on its past growth.
Remember that this metric is backwards looking - it shows what has happened in the past, and does not accurately predict the future. ROCE can be deceptive for cyclical businesses, as returns can look incredible in boom times, and terribly low in downturns. ROCE is only a point-in-time measure. What happens in the future is pretty important for investors, so we have prepared a free report on analyst forecasts for GUD Holdings.
What Are Current Liabilities, And How Do They Affect GUD Holdings's ROCE?
Liabilities, such as supplier bills and bank overdrafts, are referred to as current liabilities if they need to be paid within 12 months. Due to the way the ROCE equation works, having large bills due in the near term can make it look as though a company has less capital employed, and thus a higher ROCE than usual. To counteract this, we check if a company has high current liabilities, relative to its total assets.
GUD Holdings has total assets of AU$526m and current liabilities of AU$86m. As a result, its current liabilities are equal to approximately 16% of its total assets. Current liabilities are minimal, limiting the impact on ROCE.
The Bottom Line On GUD Holdings's ROCE
Overall, GUD Holdings has a decent ROCE and could be worthy of further research. GUD Holdings shapes up well under this analysis, but it is far from the only business delivering excellent numbers . You might also want to check this free collection of companies delivering excellent earnings growth.
GUD Holdings is not the only stock that insiders are buying. For those who like to find winning investments this free list of growing companies with recent insider purchasing, could be just the ticket.
We aim to bring you long-term focused research analysis driven by fundamental data. Note that our analysis may not factor in the latest price-sensitive company announcements or qualitative material.
If you spot an error that warrants correction, please contact the editor at editorial-team@simplywallst.com. This article by Simply Wall St is general in nature. It does not constitute a recommendation to buy or sell any stock, and does not take account of your objectives, or your financial situation. Simply Wall St has no position in the stocks mentioned. Thank you for reading.
