
 Yahoo Finance
 Why Mount Gibson Iron Limited's (ASX:MGX) High P/E Ratio Isn't Necessarily A Bad Thing

Want to participate in a short research study? Help shape the future of investing tools and you could win a $250 gift card!
Today, we'll introduce the concept of the P/E ratio for those who are learning about investing. We'll look at Mount Gibson Iron Limited's (ASX:MGX) P/E ratio and reflect on what it tells us about the company's share price. What is Mount Gibson Iron's P/E ratio? Well, based on the last twelve months it is 16.79. In other words, at today's prices, investors are paying A$16.79 for every A$1 in prior year profit.
Check out our latest analysis for Mount Gibson Iron
How Do You Calculate A P/E Ratio?
The formula for P/E is:
Price to Earnings Ratio = Share Price ÷ Earnings per Share (EPS)
Or for Mount Gibson Iron:
P/E of 16.79 = A$0.98 ÷ A$0.058 (Based on the year to December 2018.)
Is A High Price-to-Earnings Ratio Good?
A higher P/E ratio implies that investors pay a higher price for the earning power of the business. That isn't necessarily good or bad, but a high P/E implies relatively high expectations of what a company can achieve in the future.
How Growth Rates Impact P/E Ratios
P/E ratios primarily reflect market expectations around earnings growth rates. That's because companies that grow earnings per share quickly will rapidly increase the 'E' in the equation. That means unless the share price increases, the P/E will reduce in a few years. So while a stock may look expensive based on past earnings, it could be cheap based on future earnings.
Mount Gibson Iron shrunk earnings per share by 25% over the last year. And it has shrunk its earnings per share by 20% per year over the last five years. This growth rate might warrant a below average P/E ratio.
Does Mount Gibson Iron Have A Relatively High Or Low P/E For Its Industry?
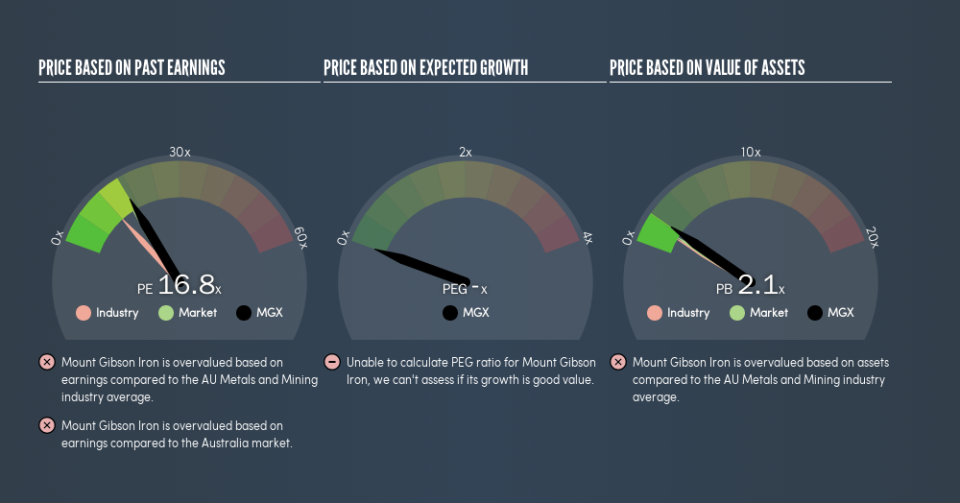
We can get an indication of market expectations by looking at the P/E ratio. The image below shows that Mount Gibson Iron has a higher P/E than the average (12) P/E for companies in the metals and mining industry.
Its relatively high P/E ratio indicates that Mount Gibson Iron shareholders think it will perform better than other companies in its industry classification. The market is optimistic about the future, but that doesn't guarantee future growth. So investors should delve deeper. I like to check if company insiders have been buying or selling.
A Limitation: P/E Ratios Ignore Debt and Cash In The Bank
Don't forget that the P/E ratio considers market capitalization. So it won't reflect the advantage of cash, or disadvantage of debt. In theory, a company can lower its future P/E ratio by using cash or debt to invest in growth.
Such spending might be good or bad, overall, but the key point here is that you need to look at debt to understand the P/E ratio in context.
So What Does Mount Gibson Iron's Balance Sheet Tell Us?
Mount Gibson Iron has net cash of AU$431m. This is fairly high at 37% of its market capitalization. That might mean balance sheet strength is important to the business, but should also help push the P/E a bit higher than it would otherwise be.
The Verdict On Mount Gibson Iron's P/E Ratio
Mount Gibson Iron's P/E is 16.8 which is about average (15.9) in the AU market. Although the recent drop in earnings per share would keep the market cautious, the net cash position means it's not surprising that expectations put the company roughly in line with the market average P/E.
Investors have an opportunity when market expectations about a stock are wrong. If the reality for a company is better than it expects, you can make money by buying and holding for the long term. So this free report on the analyst consensus forecasts could help you make a master move on this stock.
Of course you might be able to find a better stock than Mount Gibson Iron. So you may wish to see this free collection of other companies that have grown earnings strongly.
We aim to bring you long-term focused research analysis driven by fundamental data. Note that our analysis may not factor in the latest price-sensitive company announcements or qualitative material.
If you spot an error that warrants correction, please contact the editor at editorial-team@simplywallst.com. This article by Simply Wall St is general in nature. It does not constitute a recommendation to buy or sell any stock, and does not take account of your objectives, or your financial situation. Simply Wall St has no position in the stocks mentioned. Thank you for reading.
