
 Yahoo Finance
 Why Investors Shouldn't Be Surprised By Unity Software Inc.'s (NYSE:U) P/S
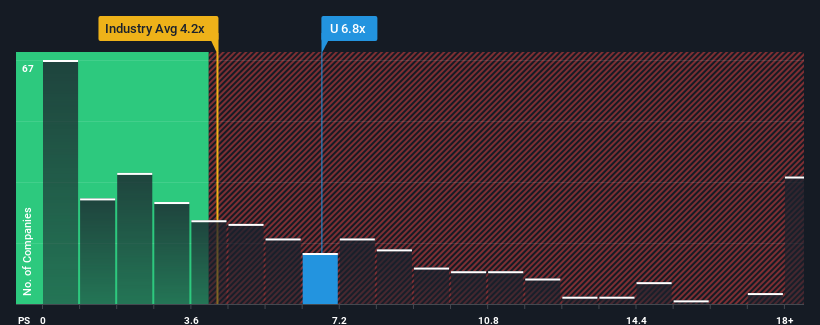
Unity Software Inc.'s (NYSE:U) price-to-sales (or "P/S") ratio of 6.8x might make it look like a strong sell right now compared to the Software industry in the United States, where around half of the companies have P/S ratios below 4.2x and even P/S below 1.8x are quite common. Although, it's not wise to just take the P/S at face value as there may be an explanation why it's so lofty.
See our latest analysis for Unity Software
How Has Unity Software Performed Recently?
Recent times have been advantageous for Unity Software as its revenues have been rising faster than most other companies. It seems the market expects this form will continue into the future, hence the elevated P/S ratio. However, if this isn't the case, investors might get caught out paying too much for the stock.
Want the full picture on analyst estimates for the company? Then our free report on Unity Software will help you uncover what's on the horizon.
Is There Enough Revenue Growth Forecasted For Unity Software?
In order to justify its P/S ratio, Unity Software would need to produce outstanding growth that's well in excess of the industry.
If we review the last year of revenue growth, the company posted a terrific increase of 25%. Pleasingly, revenue has also lifted 157% in aggregate from three years ago, thanks to the last 12 months of growth. So we can start by confirming that the company has done a great job of growing revenue over that time.
Looking ahead now, revenue is anticipated to climb by 29% per annum during the coming three years according to the analysts following the company. Meanwhile, the rest of the industry is forecast to only expand by 13% per annum, which is noticeably less attractive.
With this in mind, it's not hard to understand why Unity Software's P/S is high relative to its industry peers. It seems most investors are expecting this strong future growth and are willing to pay more for the stock.
The Bottom Line On Unity Software's P/S
It's argued the price-to-sales ratio is an inferior measure of value within certain industries, but it can be a powerful business sentiment indicator.
As we suspected, our examination of Unity Software's analyst forecasts revealed that its superior revenue outlook is contributing to its high P/S. It appears that shareholders are confident in the company's future revenues, which is propping up the P/S. Unless the analysts have really missed the mark, these strong revenue forecasts should keep the share price buoyant.
It's always necessary to consider the ever-present spectre of investment risk. We've identified 4 warning signs with Unity Software, and understanding them should be part of your investment process.
It's important to make sure you look for a great company, not just the first idea you come across. So if growing profitability aligns with your idea of a great company, take a peek at this free list of interesting companies with strong recent earnings growth (and a low P/E).
Have feedback on this article? Concerned about the content? Get in touch with us directly. Alternatively, email editorial-team (at) simplywallst.com.
This article by Simply Wall St is general in nature. We provide commentary based on historical data and analyst forecasts only using an unbiased methodology and our articles are not intended to be financial advice. It does not constitute a recommendation to buy or sell any stock, and does not take account of your objectives, or your financial situation. We aim to bring you long-term focused analysis driven by fundamental data. Note that our analysis may not factor in the latest price-sensitive company announcements or qualitative material. Simply Wall St has no position in any stocks mentioned.
Join A Paid User Research Session
You’ll receive a US$30 Amazon Gift card for 1 hour of your time while helping us build better investing tools for the individual investors like yourself. Sign up here
