
 Yahoo Finance
 Why Investors Shouldn't Be Surprised By Transocean Ltd.'s (NYSE:RIG) P/S
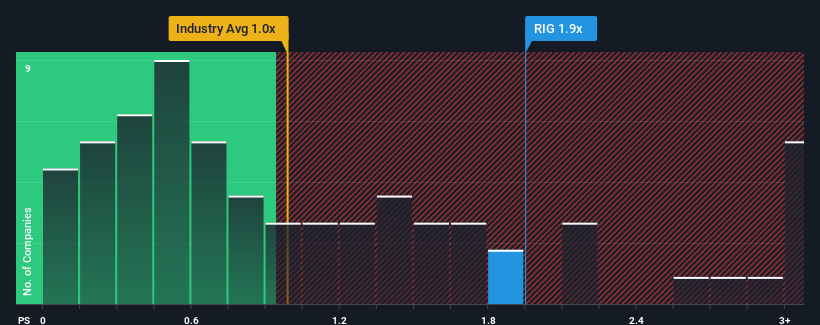
When close to half the companies in the Energy Services industry in the United States have price-to-sales ratios (or "P/S") below 1x, you may consider Transocean Ltd. (NYSE:RIG) as a stock to potentially avoid with its 1.9x P/S ratio. Nonetheless, we'd need to dig a little deeper to determine if there is a rational basis for the elevated P/S.
Check out our latest analysis for Transocean
What Does Transocean's Recent Performance Look Like?
Transocean could be doing better as it's been growing revenue less than most other companies lately. One possibility is that the P/S ratio is high because investors think this lacklustre revenue performance will improve markedly. You'd really hope so, otherwise you're paying a pretty hefty price for no particular reason.
If you'd like to see what analysts are forecasting going forward, you should check out our free report on Transocean.
What Are Revenue Growth Metrics Telling Us About The High P/S?
Transocean's P/S ratio would be typical for a company that's expected to deliver solid growth, and importantly, perform better than the industry.
Retrospectively, the last year delivered virtually the same number to the company's top line as the year before. Whilst it's an improvement, it wasn't enough to get the company out of the hole it was in, with revenue down 17% overall from three years ago. Accordingly, shareholders would have felt downbeat about the medium-term rates of revenue growth.
Shifting to the future, estimates from the eleven analysts covering the company suggest revenue should grow by 15% per annum over the next three years. Meanwhile, the rest of the industry is forecast to only expand by 13% per year, which is noticeably less attractive.
With this in mind, it's not hard to understand why Transocean's P/S is high relative to its industry peers. It seems most investors are expecting this strong future growth and are willing to pay more for the stock.
What Does Transocean's P/S Mean For Investors?
We'd say the price-to-sales ratio's power isn't primarily as a valuation instrument but rather to gauge current investor sentiment and future expectations.
We've established that Transocean maintains its high P/S on the strength of its forecasted revenue growth being higher than the the rest of the Energy Services industry, as expected. At this stage investors feel the potential for a deterioration in revenues is quite remote, justifying the elevated P/S ratio. It's hard to see the share price falling strongly in the near future under these circumstances.
It's always necessary to consider the ever-present spectre of investment risk. We've identified 1 warning sign with Transocean, and understanding should be part of your investment process.
If you're unsure about the strength of Transocean's business, why not explore our interactive list of stocks with solid business fundamentals for some other companies you may have missed.
Have feedback on this article? Concerned about the content? Get in touch with us directly. Alternatively, email editorial-team (at) simplywallst.com.
This article by Simply Wall St is general in nature. We provide commentary based on historical data and analyst forecasts only using an unbiased methodology and our articles are not intended to be financial advice. It does not constitute a recommendation to buy or sell any stock, and does not take account of your objectives, or your financial situation. We aim to bring you long-term focused analysis driven by fundamental data. Note that our analysis may not factor in the latest price-sensitive company announcements or qualitative material. Simply Wall St has no position in any stocks mentioned.
Join A Paid User Research Session
You’ll receive a US$30 Amazon Gift card for 1 hour of your time while helping us build better investing tools for the individual investors like yourself. Sign up here
