
 Yahoo Finance
 Why Hanmi Financial Corporation’s (NASDAQ:HAFC) CEO Pay Matters To You

C.G. Kum has been the CEO of Hanmi Financial Corporation (NASDAQ:HAFC) since 2013. First, this article will compare CEO compensation with compensation at similar sized companies. Next, we’ll consider growth that the business demonstrates. And finally – as a second measure of performance – we will look at the returns shareholders have received over the last few years. This process should give us an idea about how appropriately the CEO is paid.
View our latest analysis for Hanmi Financial
Want to help shape the future of investing tools and platforms? Take the survey and be part of one of the most advanced studies of stock market investors to date.
How Does C.G. Kum’s Compensation Compare With Similar Sized Companies?
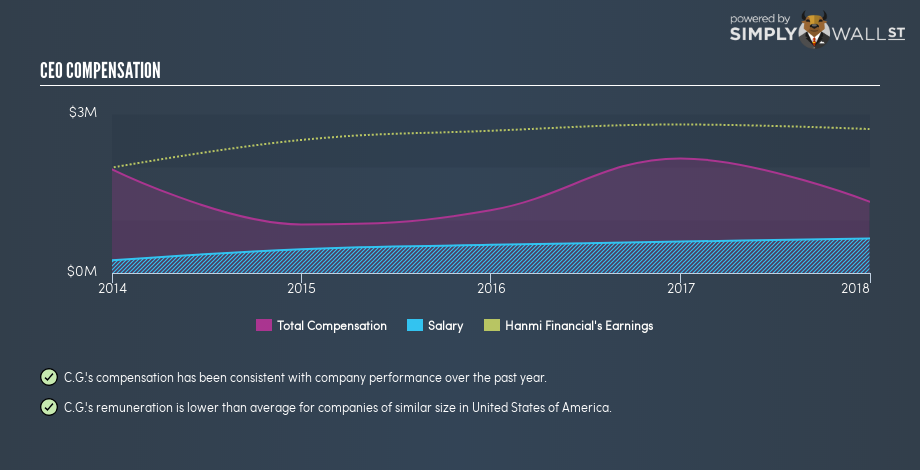
Our data indicates that Hanmi Financial Corporation is worth US$661m, and total annual CEO compensation is US$1.3m. (This number is for the twelve months until 2017). We think total compensation is more important but we note that the CEO salary is lower, at US$652k. We examined companies with market caps from US$400m to US$1.6b, and discovered that the median CEO compensation of that group was US$2.3m.
Most shareholders would consider it a positive that C.G. Kum takes less compensation than the CEOs of most similar size companies, leaving more for shareholders. While this is a good thing, you’ll need to understand the business better before you can form an opinion.
You can see a visual representation of the CEO compensation at Hanmi Financial, below.
Is Hanmi Financial Corporation Growing?
On average over the last three years, Hanmi Financial Corporation has grown earnings per share (EPS) by 2.5% each year (using a line of best fit). The trailing twelve months of revenue was pretty much the same as the prior period.
I’m not particularly impressed by the revenue growth, but it is good to see modest EPS growth. It’s clear the performance has been quite decent, but it it falls short of outstanding,based on this information.
Shareholders might be interested in this free visualization of analyst forecasts. .
Has Hanmi Financial Corporation Been A Good Investment?
Hanmi Financial Corporation has not done too badly by shareholders, with a total return of 7.5%, over three years. But they probably wouldn’t be so happy as to think the CEO should be paid more than is normal, for companies around this size.
In Summary…
It appears that Hanmi Financial Corporation remunerates its CEO below most similar sized companies.
C.G. Kum is paid less than what is normal at similar size companies, and but overall performance has left me uninspired. However I do not find the CEO compensation to be concerning. If you think CEO compensation levels are interesting you will probably really like this free visualization of insider trading at Hanmi Financial.
Or you might prefer this data-rich interactive visualization of historic revenue and earnings.
To help readers see past the short term volatility of the financial market, we aim to bring you a long-term focused research analysis purely driven by fundamental data. Note that our analysis does not factor in the latest price-sensitive company announcements.
The author is an independent contributor and at the time of publication had no position in the stocks mentioned. For errors that warrant correction please contact the editor at editorial-team@simplywallst.com.
