
 Yahoo Finance
 Why Downer EDI Limited’s (ASX:DOW) ROE Of 2.73% Does Not Tell The Whole Story

Downer EDI Limited (ASX:DOW) delivered a less impressive 2.73% ROE over the past year, compared to the 9.08% return generated by its industry. Though DOW’s recent performance is underwhelming, it is useful to understand what ROE is made up of and how it should be interpreted. Knowing these components can change your views on DOW’s below-average returns. Metrics such as financial leverage can impact the level of ROE which in turn can affect the sustainability of DOW’s returns. Let me show you what I mean by this. Check out our latest analysis for Downer EDI
What you must know about ROE
Return on Equity (ROE) weighs Downer EDI’s profit against the level of its shareholders’ equity. An ROE of 2.73% implies A$0.03 returned on every A$1 invested. In most cases, a higher ROE is preferred; however, there are many other factors we must consider prior to making any investment decisions.
Return on Equity = Net Profit ÷ Shareholders Equity
ROE is measured against cost of equity in order to determine the efficiency of Downer EDI’s equity capital deployed. Its cost of equity is 8.55%. Given a discrepancy of -5.83% between return and cost, this indicated that Downer EDI may be paying more for its capital than what it’s generating in return. ROE can be broken down into three different ratios: net profit margin, asset turnover, and financial leverage. This is called the Dupont Formula:
Dupont Formula
ROE = profit margin × asset turnover × financial leverage
ROE = (annual net profit ÷ sales) × (sales ÷ assets) × (assets ÷ shareholders’ equity)
ROE = annual net profit ÷ shareholders’ equity
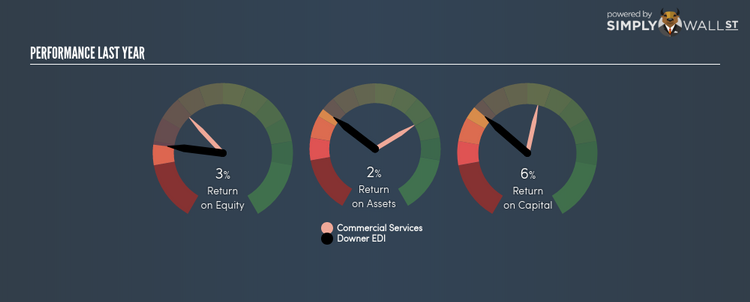
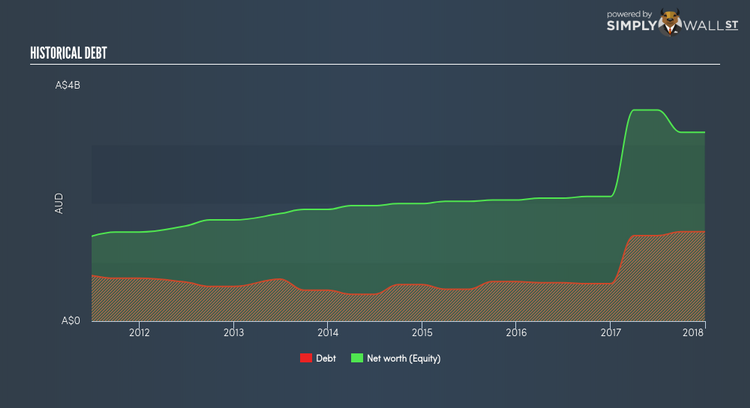
Basically, profit margin measures how much of revenue trickles down into earnings which illustrates how efficient the business is with its cost management. Asset turnover shows how much revenue Downer EDI can generate with its current asset base. Finally, financial leverage will be our main focus today. It shows how much of assets are funded by equity and can show how sustainable the company’s capital structure is. Since ROE can be inflated by excessive debt, we need to examine Downer EDI’s debt-to-equity level. Currently the debt-to-equity ratio stands at a low 47.36%, which means Downer EDI still has headroom to take on more leverage in order to increase profits.
Next Steps:
While ROE is a relatively simple calculation, it can be broken down into different ratios, each telling a different story about the strengths and weaknesses of a company. Downer EDI exhibits a weak ROE against its peers, as well as insufficient levels to cover its own cost of equity this year. Although, its appropriate level of leverage means investors can be more confident in the sustainability of Downer EDI’s return with a possible increase should the company decide to increase its debt levels. Although ROE can be a useful metric, it is only a small part of diligent research.
For Downer EDI, I’ve put together three relevant aspects you should further research:
Financial Health: Does it have a healthy balance sheet? Take a look at our free balance sheet analysis with six simple checks on key factors like leverage and risk.
Valuation: What is Downer EDI worth today? Is the stock undervalued, even when its growth outlook is factored into its intrinsic value? The intrinsic value infographic in our free research report helps visualize whether Downer EDI is currently mispriced by the market.
Other High-Growth Alternatives : Are there other high-growth stocks you could be holding instead of Downer EDI? Explore our interactive list of stocks with large growth potential to get an idea of what else is out there you may be missing!
To help readers see pass the short term volatility of the financial market, we aim to bring you a long-term focused research analysis purely driven by fundamental data. Note that our analysis does not factor in the latest price sensitive company announcements.
The author is an independent contributor and at the time of publication had no position in the stocks mentioned.
