
 Yahoo Finance
 Why Data#3 Limited’s (ASX:DTL) Return On Capital Employed Is Impressive

Today we'll look at Data#3 Limited (ASX:DTL) and reflect on its potential as an investment. Specifically, we're going to calculate its Return On Capital Employed (ROCE), in the hopes of getting some insight into the business.
Firstly, we'll go over how we calculate ROCE. Then we'll compare its ROCE to similar companies. And finally, we'll look at how its current liabilities are impacting its ROCE.
What is Return On Capital Employed (ROCE)?
ROCE measures the amount of pre-tax profits a company can generate from the capital employed in its business. Generally speaking a higher ROCE is better. Ultimately, it is a useful but imperfect metric. Renowned investment researcher Michael Mauboussin has suggested that a high ROCE can indicate that 'one dollar invested in the company generates value of more than one dollar'.
So, How Do We Calculate ROCE?
The formula for calculating the return on capital employed is:
Return on Capital Employed = Earnings Before Interest and Tax (EBIT) ÷ (Total Assets - Current Liabilities)
Or for Data#3:
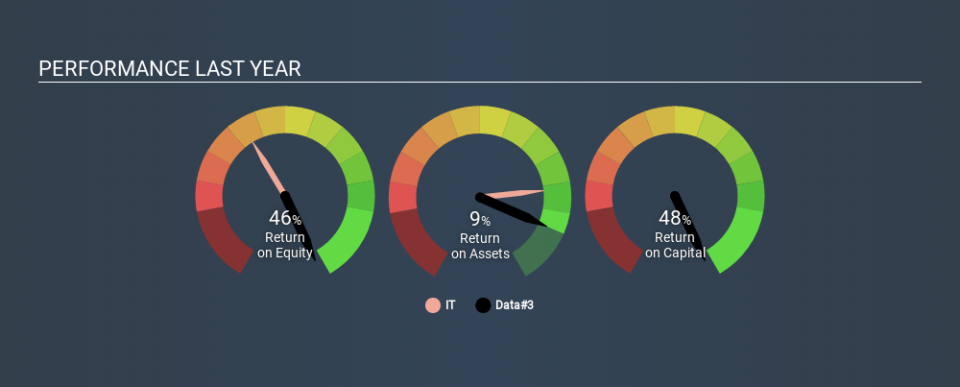
0.48 = AU$31m ÷ (AU$235m - AU$172m) (Based on the trailing twelve months to December 2019.)
So, Data#3 has an ROCE of 48%.
See our latest analysis for Data#3
Is Data#3's ROCE Good?
ROCE is commonly used for comparing the performance of similar businesses. Data#3's ROCE appears to be substantially greater than the 12% average in the IT industry. We would consider this a positive, as it suggests it is using capital more effectively than other similar companies. Regardless of the industry comparison, in absolute terms, Data#3's ROCE currently appears to be excellent.
You can click on the image below to see (in greater detail) how Data#3's past growth compares to other companies.
When considering this metric, keep in mind that it is backwards looking, and not necessarily predictive. Companies in cyclical industries can be difficult to understand using ROCE, as returns typically look high during boom times, and low during busts. ROCE is, after all, simply a snap shot of a single year. Future performance is what matters, and you can see analyst predictions in our free report on analyst forecasts for the company.
Data#3's Current Liabilities And Their Impact On Its ROCE
Short term (or current) liabilities, are things like supplier invoices, overdrafts, or tax bills that need to be paid within 12 months. Due to the way ROCE is calculated, a high level of current liabilities makes a company look as though it has less capital employed, and thus can (sometimes unfairly) boost the ROCE. To counteract this, we check if a company has high current liabilities, relative to its total assets.
Data#3 has total assets of AU$235m and current liabilities of AU$172m. As a result, its current liabilities are equal to approximately 73% of its total assets. While a high level of current liabilities boosts its ROCE, Data#3's returns are still very good.
What We Can Learn From Data#3's ROCE
In my book, this business could be worthy of further research. Data#3 looks strong on this analysis, but there are plenty of other companies that could be a good opportunity . Here is a free list of companies growing earnings rapidly.
I will like Data#3 better if I see some big insider buys. While we wait, check out this free list of growing companies with considerable, recent, insider buying.
If you spot an error that warrants correction, please contact the editor at editorial-team@simplywallst.com. This article by Simply Wall St is general in nature. It does not constitute a recommendation to buy or sell any stock, and does not take account of your objectives, or your financial situation. Simply Wall St has no position in the stocks mentioned.
We aim to bring you long-term focused research analysis driven by fundamental data. Note that our analysis may not factor in the latest price-sensitive company announcements or qualitative material. Thank you for reading.
