
 Yahoo Finance
 Why You Should Care About Wayside Technology Group's (NASDAQ:WSTG) Strong Returns On Capital
If you're not sure where to start when looking for the next multi-bagger, there are a few key trends you should keep an eye out for. One common approach is to try and find a company with returns on capital employed (ROCE) that are increasing, in conjunction with a growing amount of capital employed. If you see this, it typically means it's a company with a great business model and plenty of profitable reinvestment opportunities. So, when we ran our eye over Wayside Technology Group's (NASDAQ:WSTG) trend of ROCE, we really liked what we saw.
What is Return On Capital Employed (ROCE)?
For those that aren't sure what ROCE is, it measures the amount of pre-tax profits a company can generate from the capital employed in its business. The formula for this calculation on Wayside Technology Group is:
Return on Capital Employed = Earnings Before Interest and Tax (EBIT) ÷ (Total Assets - Current Liabilities)
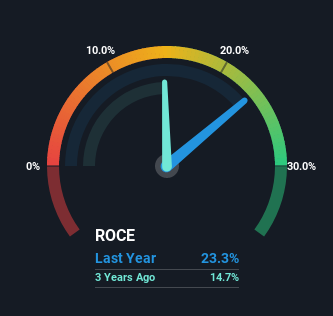
0.23 = US$13m ÷ (US$189m - US$131m) (Based on the trailing twelve months to March 2022).
So, Wayside Technology Group has an ROCE of 23%. In absolute terms that's a great return and it's even better than the Electronic industry average of 11%.
See our latest analysis for Wayside Technology Group
While the past is not representative of the future, it can be helpful to know how a company has performed historically, which is why we have this chart above. If you want to delve into the historical earnings, revenue and cash flow of Wayside Technology Group, check out these free graphs here.
What Can We Tell From Wayside Technology Group's ROCE Trend?
It's hard not to be impressed by Wayside Technology Group's returns on capital. The company has employed 56% more capital in the last five years, and the returns on that capital have remained stable at 23%. Returns like this are the envy of most businesses and given it has repeatedly reinvested at these rates, that's even better. If Wayside Technology Group can keep this up, we'd be very optimistic about its future.
Another thing to note, Wayside Technology Group has a high ratio of current liabilities to total assets of 70%. This effectively means that suppliers (or short-term creditors) are funding a large portion of the business, so just be aware that this can introduce some elements of risk. While it's not necessarily a bad thing, it can be beneficial if this ratio is lower.
In Conclusion...
In summary, we're delighted to see that Wayside Technology Group has been compounding returns by reinvesting at consistently high rates of return, as these are common traits of a multi-bagger. And long term investors would be thrilled with the 115% return they've received over the last five years. So while investors seem to be recognizing these promising trends, we still believe the stock deserves further research.
One more thing: We've identified 2 warning signs with Wayside Technology Group (at least 1 which is significant) , and understanding them would certainly be useful.
If you'd like to see other companies earning high returns, check out our free list of companies earning high returns with solid balance sheets here.
Have feedback on this article? Concerned about the content? Get in touch with us directly. Alternatively, email editorial-team (at) simplywallst.com.
This article by Simply Wall St is general in nature. We provide commentary based on historical data and analyst forecasts only using an unbiased methodology and our articles are not intended to be financial advice. It does not constitute a recommendation to buy or sell any stock, and does not take account of your objectives, or your financial situation. We aim to bring you long-term focused analysis driven by fundamental data. Note that our analysis may not factor in the latest price-sensitive company announcements or qualitative material. Simply Wall St has no position in any stocks mentioned.
