
 Yahoo Finance
 Why You Should Care About Royal Gold, Inc.’s (NASDAQ:RGLD) Low Return On Capital

Today we'll evaluate Royal Gold, Inc. (NASDAQ:RGLD) to determine whether it could have potential as an investment idea. Specifically, we're going to calculate its Return On Capital Employed (ROCE), in the hopes of getting some insight into the business.
First, we'll go over how we calculate ROCE. Second, we'll look at its ROCE compared to similar companies. Last but not least, we'll look at what impact its current liabilities have on its ROCE.
Understanding Return On Capital Employed (ROCE)
ROCE is a metric for evaluating how much pre-tax income (in percentage terms) a company earns on the capital invested in its business. In general, businesses with a higher ROCE are usually better quality. Ultimately, it is a useful but imperfect metric. Author Edwin Whiting says to be careful when comparing the ROCE of different businesses, since 'No two businesses are exactly alike.
So, How Do We Calculate ROCE?
Analysts use this formula to calculate return on capital employed:
Return on Capital Employed = Earnings Before Interest and Tax (EBIT) ÷ (Total Assets - Current Liabilities)
Or for Royal Gold:
0.078 = US$195m ÷ (US$2.5b - US$50m) (Based on the trailing twelve months to March 2020.)
So, Royal Gold has an ROCE of 7.8%.
See our latest analysis for Royal Gold
Does Royal Gold Have A Good ROCE?
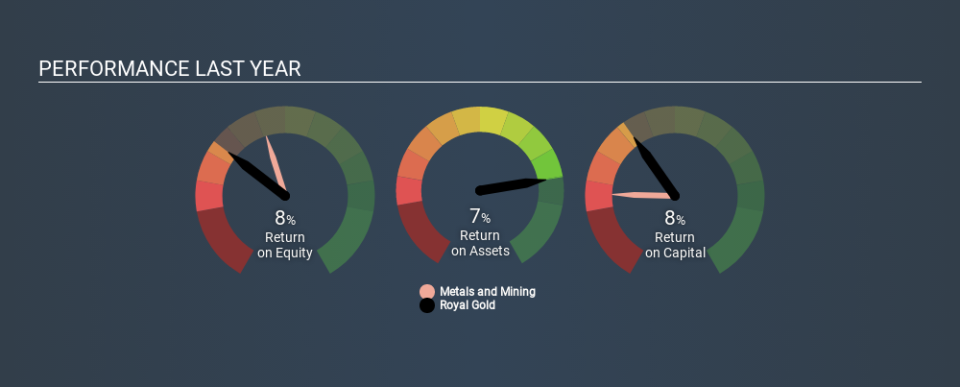
When making comparisons between similar businesses, investors may find ROCE useful. We can see Royal Gold's ROCE is meaningfully below the Metals and Mining industry average of 11%. This could be seen as a negative, as it suggests some competitors may be employing their capital more efficiently. Separate from how Royal Gold stacks up against its industry, its ROCE in absolute terms is mediocre; relative to the returns on government bonds. It is possible that there are more rewarding investments out there.
Our data shows that Royal Gold currently has an ROCE of 7.8%, compared to its ROCE of 1.4% 3 years ago. This makes us wonder if the company is improving. You can click on the image below to see (in greater detail) how Royal Gold's past growth compares to other companies.
When considering ROCE, bear in mind that it reflects the past and does not necessarily predict the future. Companies in cyclical industries can be difficult to understand using ROCE, as returns typically look high during boom times, and low during busts. ROCE is only a point-in-time measure. Remember that most companies like Royal Gold are cyclical businesses. Future performance is what matters, and you can see analyst predictions in our free report on analyst forecasts for the company.
Royal Gold's Current Liabilities And Their Impact On Its ROCE
Current liabilities include invoices, such as supplier payments, short-term debt, or a tax bill, that need to be paid within 12 months. The ROCE equation subtracts current liabilities from capital employed, so a company with a lot of current liabilities appears to have less capital employed, and a higher ROCE than otherwise. To counteract this, we check if a company has high current liabilities, relative to its total assets.
Royal Gold has total assets of US$2.5b and current liabilities of US$50m. Therefore its current liabilities are equivalent to approximately 2.0% of its total assets. With low levels of current liabilities, at least Royal Gold's mediocre ROCE is not unduly boosted.
What We Can Learn From Royal Gold's ROCE
Royal Gold looks like an ok business, but on this analysis it is not at the top of our buy list. You might be able to find a better investment than Royal Gold. If you want a selection of possible winners, check out this free list of interesting companies that trade on a P/E below 20 (but have proven they can grow earnings).
If you are like me, then you will not want to miss this free list of growing companies that insiders are buying.
If you spot an error that warrants correction, please contact the editor at editorial-team@simplywallst.com. This article by Simply Wall St is general in nature. It does not constitute a recommendation to buy or sell any stock, and does not take account of your objectives, or your financial situation. Simply Wall St has no position in the stocks mentioned.
We aim to bring you long-term focused research analysis driven by fundamental data. Note that our analysis may not factor in the latest price-sensitive company announcements or qualitative material. Thank you for reading.
