
 Yahoo Finance
 Why You Should Care About Johns Lyng Group Limited’s (ASX:JLG) Cash Levels
If you are currently a shareholder in Johns Lyng Group Limited (ASX:JLG), or considering investing in the stock, you need to examine how the business generates cash, and how it is reinvested. What is left after investment, determines the value of the stock since this cash flow technically belongs to investors of the company. I will take you through JLG’s cash flow health and the risk-return concept based on the stock’s cash flow yield, using the most recent financial data. This will help you think about the company from a cash perspective, which is a crucial factor to investing.
View our latest analysis for Johns Lyng Group
Want to participate in a short research study? Help shape the future of investing tools and receive a $60 prize!
What is free cash flow?
Free cash flow (FCF) is the amount of cash Johns Lyng Group has left after it pays off its expenses, including its net capital expenditures, which is what the company needs to spend each year to maintain or grow its business operations.
The two ways to assess whether Johns Lyng Group’s FCF is sufficient, is to compare the FCF yield to the market index yield, as well as determine whether the top-line operating cash flows will continue to grow.
Free Cash Flow = Operating Cash Flows – Net Capital Expenditure
Free Cash Flow Yield = Free Cash Flow / Enterprise Value
where Enterprise Value = Market Capitalisation + Net Debt
Along with a positive operating cash flow, Johns Lyng Group also generates a positive free cash flow. However, the yield of 1.65% is not sufficient to compensate for the level of risk investors are taking on. This is because Johns Lyng Group’s yield is well-below the market yield, in addition to serving higher risk compared to the well-diversified market index.
Is Johns Lyng Group’s yield sustainable?
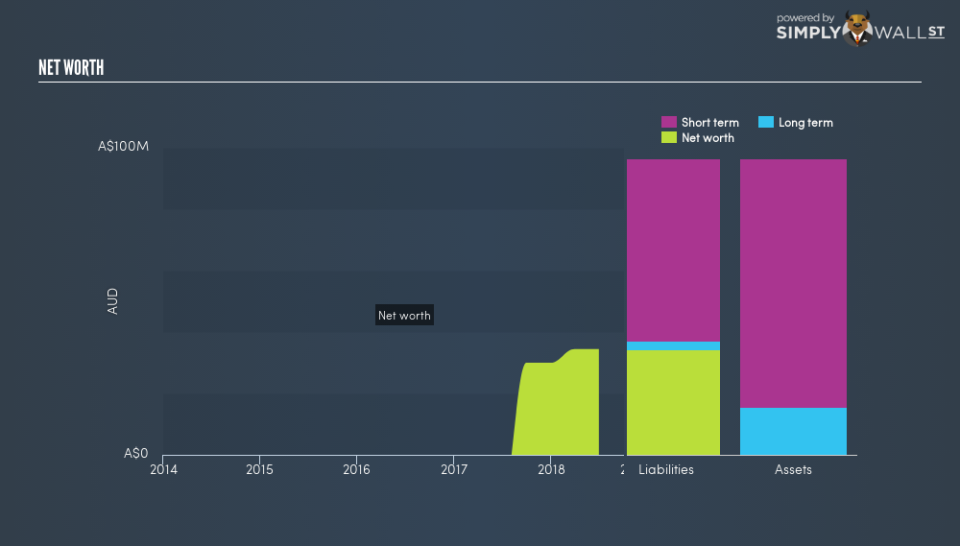
Another important consideration is whether this return is likely to be maintained over the next couple of years. We can gauge this by looking at JLG’s expected operating cash flows. In the next few years, the company is expected to grow its cash from operations at a double-digit rate of 16%, ramping up from its current levels of AU$17m to AU$19m in three years’ time. Although this seems impressive, breaking down into year-on-year growth rates, JLG’s operating cash flow growth is expected to decline from a rate of 24% in the upcoming year, to 10% by the end of the third year. But the overall future outlook seems buoyant if JLG can maintain its levels of capital expenditure as well.
Next Steps:
Low free cash flow yield means you are not currently well-compensated for the risk you’re taking on by holding onto Johns Lyng Group relative to a well-diversified market index. Moreover, the stock’s low growth prospects in terms of cash flow, seems worrisome. Now you know to keep cash flows in mind, I recommend you continue to research Johns Lyng Group to get a more holistic view of the company by looking at:
Valuation: What is JLG worth today? Is the stock undervalued, even when its growth outlook is factored into its intrinsic value? The intrinsic value infographic in our free research report helps visualize whether JLG is currently mispriced by the market.
Management Team: An experienced management team on the helm increases our confidence in the business – take a look at who sits on Johns Lyng Group’s board and the CEO’s back ground.
Other High-Performing Stocks: If you believe you should cushion your portfolio with something less risky, scroll through our free list of these great stocks here.
To help readers see past the short term volatility of the financial market, we aim to bring you a long-term focused research analysis purely driven by fundamental data. Note that our analysis does not factor in the latest price-sensitive company announcements.
The author is an independent contributor and at the time of publication had no position in the stocks mentioned. For errors that warrant correction please contact the editor at editorial-team@simplywallst.com.
