
 Yahoo Finance
 Why Brisbane Broncos Limited (ASX:BBL) Delivered An Inferior ROE Compared To The Industry

This article is intended for those of you who are at the beginning of your investing journey and want to begin learning the link between company’s fundamentals and stock market performance.
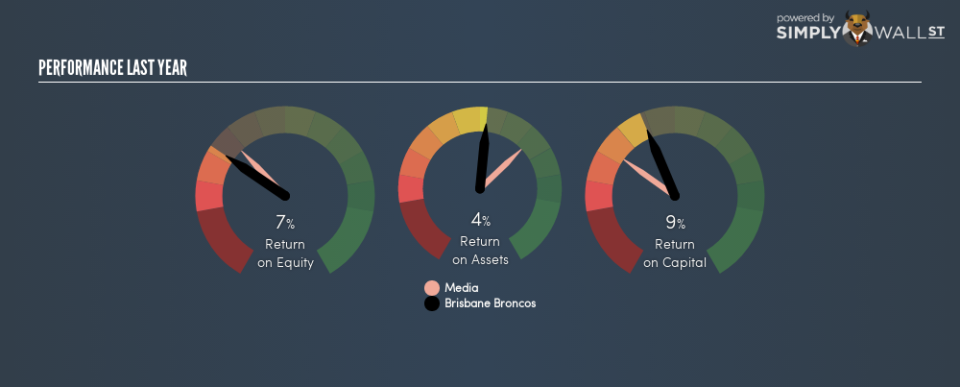
Brisbane Broncos Limited’s (ASX:BBL) most recent return on equity was a substandard 7.1% relative to its industry performance of 8.9% over the past year. Though BBL’s recent performance is underwhelming, it is useful to understand what ROE is made up of and how it should be interpreted. Knowing these components can change your views on BBL’s below-average returns. Metrics such as financial leverage can impact the level of ROE which in turn can affect the sustainability of BBL’s returns. Let me show you what I mean by this.
View our latest analysis for Brisbane Broncos
What you must know about ROE
Firstly, Return on Equity, or ROE, is simply the percentage of last years’ earning against the book value of shareholders’ equity. For example, if the company invests A$1 in the form of equity, it will generate A$0.071 in earnings from this. Generally speaking, a higher ROE is preferred; however, there are other factors we must also consider before making any conclusions.
Return on Equity = Net Profit ÷ Shareholders Equity
Returns are usually compared to costs to measure the efficiency of capital. Brisbane Broncos’s cost of equity is 8.6%. Since Brisbane Broncos’s return does not cover its cost, with a difference of -1.5%, this means its current use of equity is not efficient and not sustainable. Very simply, Brisbane Broncos pays more for its capital than what it generates in return. ROE can be dissected into three distinct ratios: net profit margin, asset turnover, and financial leverage. This is called the Dupont Formula:
Dupont Formula
ROE = profit margin × asset turnover × financial leverage
ROE = (annual net profit ÷ sales) × (sales ÷ assets) × (assets ÷ shareholders’ equity)
ROE = annual net profit ÷ shareholders’ equity
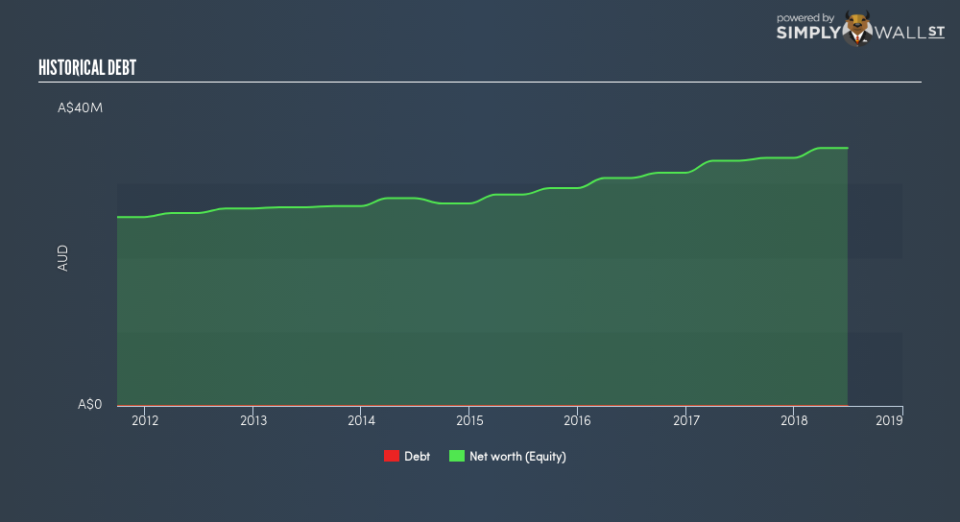
The first component is profit margin, which measures how much of sales is retained after the company pays for all its expenses. The other component, asset turnover, illustrates how much revenue Brisbane Broncos can make from its asset base. Finally, financial leverage will be our main focus today. It shows how much of assets are funded by equity and can show how sustainable the company’s capital structure is. Since ROE can be artificially increased through excessive borrowing, we should check Brisbane Broncos’s historic debt-to-equity ratio. Currently, Brisbane Broncos has no debt which means its returns are driven purely by equity capital. This could explain why Brisbane Broncos’s’ ROE is lower than its industry peers, most of which may have some degree of debt in its business.
Next Steps:
While ROE is a relatively simple calculation, it can be broken down into different ratios, each telling a different story about the strengths and weaknesses of a company. Brisbane Broncos exhibits a weak ROE against its peers, as well as insufficient levels to cover its own cost of equity this year. Although, its appropriate level of leverage means investors can be more confident in the sustainability of Brisbane Broncos’s return with a possible increase should the company decide to increase its debt levels. ROE is a helpful signal, but it is definitely not sufficient on its own to make an investment decision.
For Brisbane Broncos, I’ve compiled three fundamental factors you should further research:
Financial Health: Does it have a healthy balance sheet? Take a look at our free balance sheet analysis with six simple checks on key factors like leverage and risk.
Future Earnings: How does Brisbane Broncos’s growth rate compare to its peers and the wider market? Dig deeper into the analyst consensus number for the upcoming years by interacting with our free analyst growth expectation chart.
Other High-Growth Alternatives : Are there other high-growth stocks you could be holding instead of Brisbane Broncos? Explore our interactive list of stocks with large growth potential to get an idea of what else is out there you may be missing!
To help readers see past the short term volatility of the financial market, we aim to bring you a long-term focused research analysis purely driven by fundamental data. Note that our analysis does not factor in the latest price-sensitive company announcements.
The author is an independent contributor and at the time of publication had no position in the stocks mentioned. For errors that warrant correction please contact the editor at editorial-team@simplywallst.com.
