
 Yahoo Finance
 Whitehaven Coal's (ASX:WHC) Shareholders Are Down 66% On Their Shares
Whitehaven Coal Limited (ASX:WHC) shareholders will doubtless be very grateful to see the share price up 49% in the last quarter. But that is small recompense for the exasperating returns over three years. Regrettably, the share price slid 66% in that period. Some might say the recent bounce is to be expected after such a bad drop. After all, could be that the fall was overdone.
Check out our latest analysis for Whitehaven Coal
While the efficient markets hypothesis continues to be taught by some, it has been proven that markets are over-reactive dynamic systems, and investors are not always rational. By comparing earnings per share (EPS) and share price changes over time, we can get a feel for how investor attitudes to a company have morphed over time.
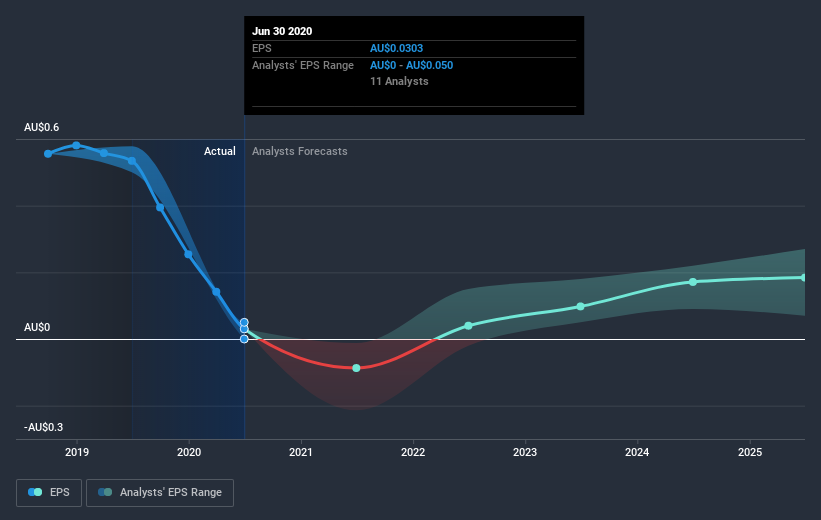
Whitehaven Coal saw its EPS decline at a compound rate of 58% per year, over the last three years. This fall in the EPS is worse than the 30% compound annual share price fall. So the market may not be too worried about the EPS figure, at the moment -- or it may have previously priced some of the drop in.
You can see below how EPS has changed over time (discover the exact values by clicking on the image).
It's good to see that there was some significant insider buying in the last three months. That's a positive. On the other hand, we think the revenue and earnings trends are much more meaningful measures of the business. Dive deeper into the earnings by checking this interactive graph of Whitehaven Coal's earnings, revenue and cash flow.
What about the Total Shareholder Return (TSR)?
Investors should note that there's a difference between Whitehaven Coal's total shareholder return (TSR) and its share price change, which we've covered above. The TSR is a return calculation that accounts for the value of cash dividends (assuming that any dividend received was reinvested) and the calculated value of any discounted capital raisings and spin-offs. Dividends have been really beneficial for Whitehaven Coal shareholders, and that cash payout explains why its total shareholder loss of 58%, over the last 3 years, isn't as bad as the share price return.
A Different Perspective
Whitehaven Coal shareholders are down 58% for the year, but the market itself is up 0.2%. However, keep in mind that even the best stocks will sometimes underperform the market over a twelve month period. Longer term investors wouldn't be so upset, since they would have made 14%, each year, over five years. If the fundamental data continues to indicate long term sustainable growth, the current sell-off could be an opportunity worth considering. I find it very interesting to look at share price over the long term as a proxy for business performance. But to truly gain insight, we need to consider other information, too. Consider for instance, the ever-present spectre of investment risk. We've identified 4 warning signs with Whitehaven Coal , and understanding them should be part of your investment process.
If you like to buy stocks alongside management, then you might just love this free list of companies. (Hint: insiders have been buying them).
Please note, the market returns quoted in this article reflect the market weighted average returns of stocks that currently trade on AU exchanges.
This article by Simply Wall St is general in nature. It does not constitute a recommendation to buy or sell any stock, and does not take account of your objectives, or your financial situation. We aim to bring you long-term focused analysis driven by fundamental data. Note that our analysis may not factor in the latest price-sensitive company announcements or qualitative material. Simply Wall St has no position in any stocks mentioned.
Have feedback on this article? Concerned about the content? Get in touch with us directly. Alternatively, email editorial-team@simplywallst.com.
