
 Yahoo Finance
 We're Not Very Worried About Fertoz's (ASX:FTZ) Cash Burn Rate
There's no doubt that money can be made by owning shares of unprofitable businesses. By way of example, Fertoz (ASX:FTZ) has seen its share price rise 353% over the last year, delighting many shareholders. But the harsh reality is that very many loss making companies burn through all their cash and go bankrupt.
Given its strong share price performance, we think it's worthwhile for Fertoz shareholders to consider whether its cash burn is concerning. In this article, we define cash burn as its annual (negative) free cash flow, which is the amount of money a company spends each year to fund its growth. The first step is to compare its cash burn with its cash reserves, to give us its 'cash runway'.
Check out our latest analysis for Fertoz
How Long Is Fertoz's Cash Runway?
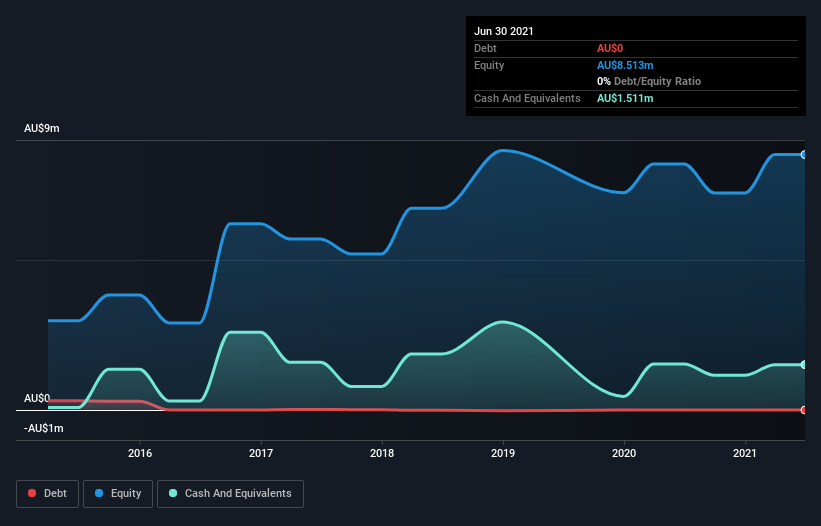
A company's cash runway is calculated by dividing its cash hoard by its cash burn. As at June 2021, Fertoz had cash of AU$1.5m and no debt. Importantly, its cash burn was AU$1.4m over the trailing twelve months. Therefore, from June 2021 it had roughly 13 months of cash runway. While that cash runway isn't too concerning, sensible holders would be peering into the distance, and considering what happens if the company runs out of cash. You can see how its cash balance has changed over time in the image below.
How Well Is Fertoz Growing?
On balance, we think it's mildly positive that Fertoz trimmed its cash burn by 19% over the last twelve months. Having said that, the revenue growth of 63% was considerably more inspiring. It seems to be growing nicely. In reality, this article only makes a short study of the company's growth data. This graph of historic revenue growth shows how Fertoz is building its business over time.
Can Fertoz Raise More Cash Easily?
Even though it seems like Fertoz is developing its business nicely, we still like to consider how easily it could raise more money to accelerate growth. Generally speaking, a listed business can raise new cash through issuing shares or taking on debt. Commonly, a business will sell new shares in itself to raise cash and drive growth. We can compare a company's cash burn to its market capitalisation to get a sense for how many new shares a company would have to issue to fund one year's operations.
Fertoz has a market capitalisation of AU$66m and burnt through AU$1.4m last year, which is 2.2% of the company's market value. That means it could easily issue a few shares to fund more growth, and might well be in a position to borrow cheaply.
Is Fertoz's Cash Burn A Worry?
It may already be apparent to you that we're relatively comfortable with the way Fertoz is burning through its cash. In particular, we think its revenue growth stands out as evidence that the company is well on top of its spending. Its weak point is its cash runway, but even that wasn't too bad! Considering all the factors discussed in this article, we're not overly concerned about the company's cash burn, although we do think shareholders should keep an eye on how it develops. On another note, Fertoz has 6 warning signs (and 1 which is significant) we think you should know about.
Of course, you might find a fantastic investment by looking elsewhere. So take a peek at this free list of interesting companies, and this list of stocks growth stocks (according to analyst forecasts)
Have feedback on this article? Concerned about the content? Get in touch with us directly. Alternatively, email editorial-team (at) simplywallst.com.
This article by Simply Wall St is general in nature. We provide commentary based on historical data and analyst forecasts only using an unbiased methodology and our articles are not intended to be financial advice. It does not constitute a recommendation to buy or sell any stock, and does not take account of your objectives, or your financial situation. We aim to bring you long-term focused analysis driven by fundamental data. Note that our analysis may not factor in the latest price-sensitive company announcements or qualitative material. Simply Wall St has no position in any stocks mentioned.
