
 Yahoo Finance
 We're Interested To See How Technology Metals Australia (ASX:TMT) Uses Its Cash Hoard To Grow
We can readily understand why investors are attracted to unprofitable companies. Indeed, Technology Metals Australia (ASX:TMT) stock is up 109% in the last year, providing strong gains for shareholders. Having said that, unprofitable companies are risky because they could potentially burn through all their cash and become distressed.
So notwithstanding the buoyant share price, we think it's well worth asking whether Technology Metals Australia's cash burn is too risky. In this report, we will consider the company's annual negative free cash flow, henceforth referring to it as the 'cash burn'. First, we'll determine its cash runway by comparing its cash burn with its cash reserves.
View our latest analysis for Technology Metals Australia
Does Technology Metals Australia Have A Long Cash Runway?
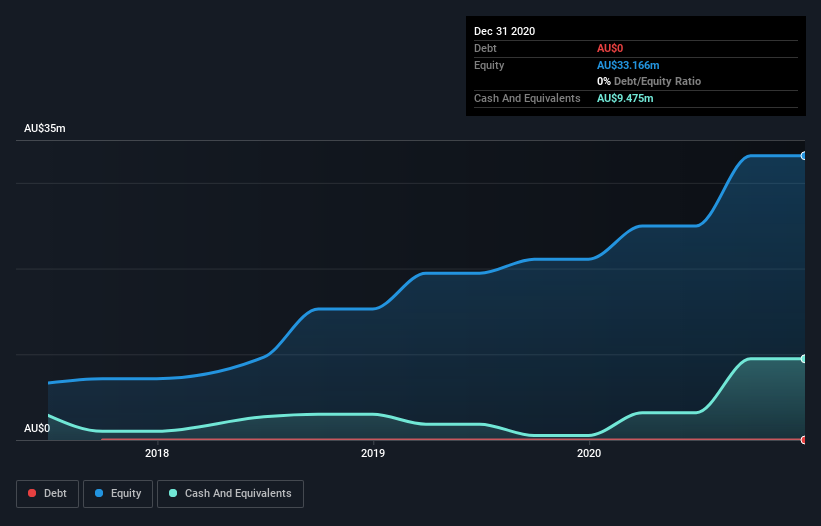
A cash runway is defined as the length of time it would take a company to run out of money if it kept spending at its current rate of cash burn. When Technology Metals Australia last reported its balance sheet in December 2020, it had zero debt and cash worth AU$9.5m. In the last year, its cash burn was AU$644k. That means it had a cash runway of very many years as of December 2020. While this is only one measure of its cash burn situation, it certainly gives us the impression that holders have nothing to worry about. The image below shows how its cash balance has been changing over the last few years.
How Easily Can Technology Metals Australia Raise Cash?
Issuing new shares, or taking on debt, are the most common ways for a listed company to raise more money for its business. Commonly, a business will sell new shares in itself to raise cash and drive growth. By comparing a company's annual cash burn to its total market capitalisation, we can estimate roughly how many shares it would have to issue in order to run the company for another year (at the same burn rate).
Since it has a market capitalisation of AU$53m, Technology Metals Australia's AU$644k in cash burn equates to about 1.2% of its market value. So it could almost certainly just borrow a little to fund another year's growth, or else easily raise the cash by issuing a few shares.
So, Should We Worry About Technology Metals Australia's Cash Burn?
Because Technology Metals Australia is an early stage company, we don't have a great deal of data on which to form an opinion of its cash burn. We would undoubtedly be more comfortable if it had reported some operating revenue. However, it is fair to say that its cash runway gave us comfort. Summing up, its cash burn doesn't bother us and we're excited to see what kind of growth it can achieve with its current cash hoard. Taking an in-depth view of risks, we've identified 2 warning signs for Technology Metals Australia that you should be aware of before investing.
Of course, you might find a fantastic investment by looking elsewhere. So take a peek at this free list of companies insiders are buying, and this list of stocks growth stocks (according to analyst forecasts)
This article by Simply Wall St is general in nature. It does not constitute a recommendation to buy or sell any stock, and does not take account of your objectives, or your financial situation. We aim to bring you long-term focused analysis driven by fundamental data. Note that our analysis may not factor in the latest price-sensitive company announcements or qualitative material. Simply Wall St has no position in any stocks mentioned.
Have feedback on this article? Concerned about the content? Get in touch with us directly. Alternatively, email editorial-team (at) simplywallst.com.
