
 Yahoo Finance
 We're Excited To See How PayGroup (ASX:PYG) Uses Its Cash Hoard To Grow

We can readily understand why investors are attracted to unprofitable companies. For example, biotech and mining exploration companies often lose money for years before finding success with a new treatment or mineral discovery. Nonetheless, only a fool would ignore the risk that a loss making company burns through its cash too quickly.
So, the natural question for PayGroup (ASX:PYG) shareholders is whether they should be concerned by its rate of cash burn. For the purpose of this article, we'll define cash burn as the amount of cash the company is spending each year to fund its growth (also called its negative free cash flow). The first step is to compare its cash burn with its cash reserves, to give us its 'cash runway'.
View our latest analysis for PayGroup
How Long Is PayGroup's Cash Runway?
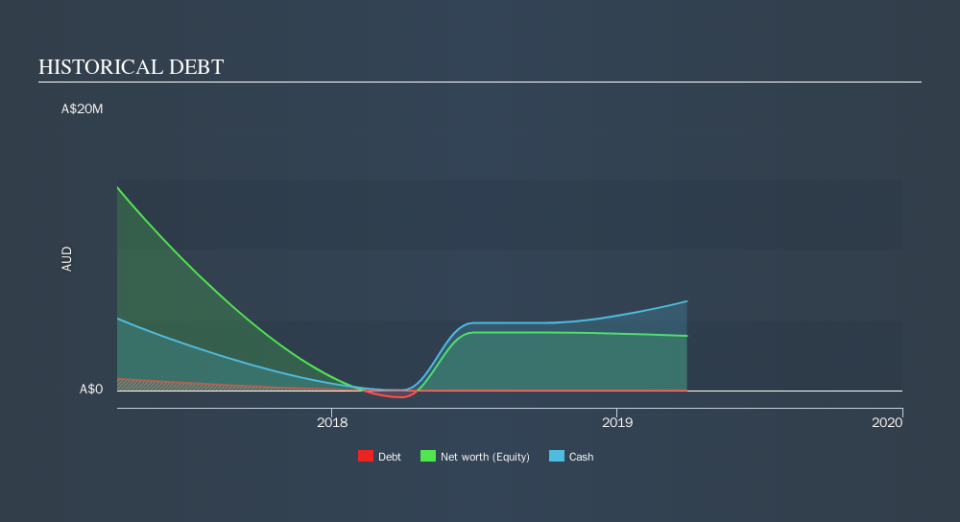
A cash runway is defined as the length of time it would take a company to run out of money if it kept spending at its current rate of cash burn. In March 2019, PayGroup had AU$6.3m in cash, and was debt-free. Importantly, its cash burn was AU$703k over the trailing twelve months. So it had a cash runway of about 9.0 years from March 2019. While this is only one measure of its cash burn situation, it certainly gives us the impression that holders have nothing to worry about. Depicted below, you can see how its cash holdings have changed over time.
Is PayGroup's Revenue Growing?
We don't yet have enough data to look at the trend in PayGroup's cash burn, so operating revenue growth is arguably the best measure of growth we have, right now. Pleasingly, the company produced stunning operating revenue growth of 188% over the last year. In reality, this article only makes a short study of the company's growth data. You can take a look at how PayGroup is growing revenue over time by checking this visualization of past revenue growth.
How Easily Can PayGroup Raise Cash?
There's no doubt PayGroup's revenue growth is impressive but even if it's only hypothetical, it's always worth asking how easily it could raise more money to fund further growth. Companies can raise capital through either debt or equity. Many companies end up issuing new shares to fund future growth. By comparing a company's annual cash burn to its total market capitalisation, we can estimate roughly how many shares it would have to issue in order to run the company for another year (at the same burn rate).
Since it has a market capitalisation of AU$39m, PayGroup's AU$703k in cash burn equates to about 1.8% of its market value. So it could almost certainly just borrow a little to fund another year's growth, or else easily raise the cash by issuing a few shares.
Is PayGroup's Cash Burn A Worry?
It may already be apparent to you that we're relatively comfortable with the way PayGroup is burning through its cash. In particular, we think its revenue growth stands out as evidence that the company is well on top of its spending. And even its cash burn relative to its market cap was very encouraging. After taking into account the various metrics mentioned in this report, we're pretty comfortable with how the company is spending its cash, as it seems on track to meet its needs over the medium term. Notably, our data indicates that PayGroup insiders have been trading the shares. You can discover if they are buyers or sellers by clicking on this link.
Of course PayGroup may not be the best stock to buy. So you may wish to see this free collection of companies boasting high return on equity, or this list of stocks that insiders are buying.
We aim to bring you long-term focused research analysis driven by fundamental data. Note that our analysis may not factor in the latest price-sensitive company announcements or qualitative material.
If you spot an error that warrants correction, please contact the editor at editorial-team@simplywallst.com. This article by Simply Wall St is general in nature. It does not constitute a recommendation to buy or sell any stock, and does not take account of your objectives, or your financial situation. Simply Wall St has no position in the stocks mentioned. Thank you for reading.
