
 Yahoo Finance
 Weng Fine Art's (FRA:WFA) Returns On Capital Not Reflecting Well On The Business
If we want to find a stock that could multiply over the long term, what are the underlying trends we should look for? Ideally, a business will show two trends; firstly a growing return on capital employed (ROCE) and secondly, an increasing amount of capital employed. Basically this means that a company has profitable initiatives that it can continue to reinvest in, which is a trait of a compounding machine. Although, when we looked at Weng Fine Art (FRA:WFA), it didn't seem to tick all of these boxes.
Understanding Return On Capital Employed (ROCE)
For those that aren't sure what ROCE is, it measures the amount of pre-tax profits a company can generate from the capital employed in its business. The formula for this calculation on Weng Fine Art is:
Return on Capital Employed = Earnings Before Interest and Tax (EBIT) ÷ (Total Assets - Current Liabilities)
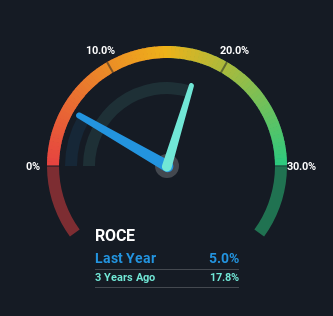
0.05 = €1.3m ÷ (€31m - €4.0m) (Based on the trailing twelve months to June 2023).
Thus, Weng Fine Art has an ROCE of 5.0%. On its own that's a low return on capital but it's in line with the industry's average returns of 5.0%.
View our latest analysis for Weng Fine Art
While the past is not representative of the future, it can be helpful to know how a company has performed historically, which is why we have this chart above. If you want to delve into the historical earnings , check out these free graphs detailing revenue and cash flow performance of Weng Fine Art.
How Are Returns Trending?
On the surface, the trend of ROCE at Weng Fine Art doesn't inspire confidence. Around five years ago the returns on capital were 9.4%, but since then they've fallen to 5.0%. And considering revenue has dropped while employing more capital, we'd be cautious. This could mean that the business is losing its competitive advantage or market share, because while more money is being put into ventures, it's actually producing a lower return - "less bang for their buck" per se.
On a side note, Weng Fine Art has done well to pay down its current liabilities to 13% of total assets. So we could link some of this to the decrease in ROCE. Effectively this means their suppliers or short-term creditors are funding less of the business, which reduces some elements of risk. Since the business is basically funding more of its operations with it's own money, you could argue this has made the business less efficient at generating ROCE.
In Conclusion...
We're a bit apprehensive about Weng Fine Art because despite more capital being deployed in the business, returns on that capital and sales have both fallen. In spite of that, the stock has delivered a 6.8% return to shareholders who held over the last five years. Either way, we aren't huge fans of the current trends and so with that we think you might find better investments elsewhere.
One final note, you should learn about the 4 warning signs we've spotted with Weng Fine Art (including 1 which is a bit unpleasant) .
For those who like to invest in solid companies, check out this free list of companies with solid balance sheets and high returns on equity.
Have feedback on this article? Concerned about the content? Get in touch with us directly. Alternatively, email editorial-team (at) simplywallst.com.
This article by Simply Wall St is general in nature. We provide commentary based on historical data and analyst forecasts only using an unbiased methodology and our articles are not intended to be financial advice. It does not constitute a recommendation to buy or sell any stock, and does not take account of your objectives, or your financial situation. We aim to bring you long-term focused analysis driven by fundamental data. Note that our analysis may not factor in the latest price-sensitive company announcements or qualitative material. Simply Wall St has no position in any stocks mentioned.
