
 Yahoo Finance
 What Is WEC Energy Group's (NYSE:WEC) P/E Ratio After Its Share Price Rocketed?

WEC Energy Group (NYSE:WEC) shares have had a really impressive month, gaining 35%, after some slippage. The full year gain of 31% is pretty reasonable, too.
Assuming no other changes, a sharply higher share price makes a stock less attractive to potential buyers. While the market sentiment towards a stock is very changeable, in the long run, the share price will tend to move in the same direction as earnings per share. So some would prefer to hold off buying when there is a lot of optimism towards a stock. One way to gauge market expectations of a stock is to look at its Price to Earnings Ratio (PE Ratio). A high P/E ratio means that investors have a high expectation about future growth, while a low P/E ratio means they have low expectations about future growth.
See our latest analysis for WEC Energy Group
How Does WEC Energy Group's P/E Ratio Compare To Its Peers?
WEC Energy Group's P/E of 27.91 indicates some degree of optimism towards the stock. As you can see below, WEC Energy Group has a higher P/E than the average company (20.4) in the integrated utilities industry.
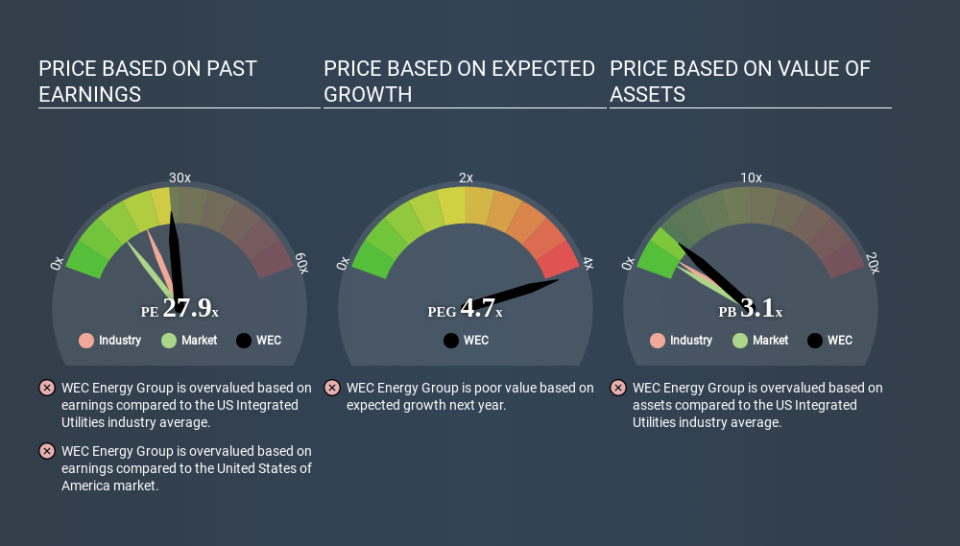
Its relatively high P/E ratio indicates that WEC Energy Group shareholders think it will perform better than other companies in its industry classification. Shareholders are clearly optimistic, but the future is always uncertain. So investors should always consider the P/E ratio alongside other factors, such as whether company directors have been buying shares.
How Growth Rates Impact P/E Ratios
Generally speaking the rate of earnings growth has a profound impact on a company's P/E multiple. If earnings are growing quickly, then the 'E' in the equation will increase faster than it would otherwise. And in that case, the P/E ratio itself will drop rather quickly. A lower P/E should indicate the stock is cheap relative to others -- and that may attract buyers.
WEC Energy Group increased earnings per share by 7.1% last year. And its annual EPS growth rate over 5 years is 6.6%.
Don't Forget: The P/E Does Not Account For Debt or Bank Deposits
Don't forget that the P/E ratio considers market capitalization. That means it doesn't take debt or cash into account. In theory, a company can lower its future P/E ratio by using cash or debt to invest in growth.
While growth expenditure doesn't always pay off, the point is that it is a good option to have; but one that the P/E ratio ignores.
Is Debt Impacting WEC Energy Group's P/E?
WEC Energy Group's net debt equates to 40% of its market capitalization. You'd want to be aware of this fact, but it doesn't bother us.
The Bottom Line On WEC Energy Group's P/E Ratio
WEC Energy Group has a P/E of 27.9. That's higher than the average in its market, which is 13.6. Given the debt is only modest, and earnings are already moving in the right direction, it's not surprising that the market expects continued improvement. What we know for sure is that investors have become much more excited about WEC Energy Group recently, since they have pushed its P/E ratio from 20.6 to 27.9 over the last month. For those who prefer to invest with the flow of momentum, that might mean it's time to put the stock on a watchlist, or research it. But the contrarian may see it as a missed opportunity.
Investors have an opportunity when market expectations about a stock are wrong. People often underestimate remarkable growth -- so investors can make money when fast growth is not fully appreciated. So this free visualization of the analyst consensus on future earnings could help you make the right decision about whether to buy, sell, or hold.
Of course, you might find a fantastic investment by looking at a few good candidates. So take a peek at this free list of companies with modest (or no) debt, trading on a P/E below 20.
If you spot an error that warrants correction, please contact the editor at editorial-team@simplywallst.com. This article by Simply Wall St is general in nature. It does not constitute a recommendation to buy or sell any stock, and does not take account of your objectives, or your financial situation. Simply Wall St has no position in the stocks mentioned.
We aim to bring you long-term focused research analysis driven by fundamental data. Note that our analysis may not factor in the latest price-sensitive company announcements or qualitative material. Thank you for reading.
