
 Yahoo Finance
 Webjet's(ASX:WEB) Share Price Is Down 64% Over The Past Three Years.
In order to justify the effort of selecting individual stocks, it's worth striving to beat the returns from a market index fund. But if you try your hand at stock picking, your risk returning less than the market. We regret to report that long term Webjet Limited (ASX:WEB) shareholders have had that experience, with the share price dropping 64% in three years, versus a market return of about 33%. There was little comfort for shareholders in the last week as the price declined a further 1.7%.
See our latest analysis for Webjet
Because Webjet made a loss in the last twelve months, we think the market is probably more focussed on revenue and revenue growth, at least for now. Shareholders of unprofitable companies usually expect strong revenue growth. That's because it's hard to be confident a company will be sustainable if revenue growth is negligible, and it never makes a profit.
Over the last three years, Webjet's revenue dropped 55% per year. That's definitely a weaker result than most pre-profit companies report. With no profits and falling revenue it is no surprise that investors have been dumping the stock, pushing the price down by 18% per year over that time. When revenue is dropping, and losses are still costing, and the share price sinking fast, it's fair to ask if something is remiss. It could be a while before the company repays long suffering shareholders with share price gains.
The company's revenue and earnings (over time) are depicted in the image below (click to see the exact numbers).
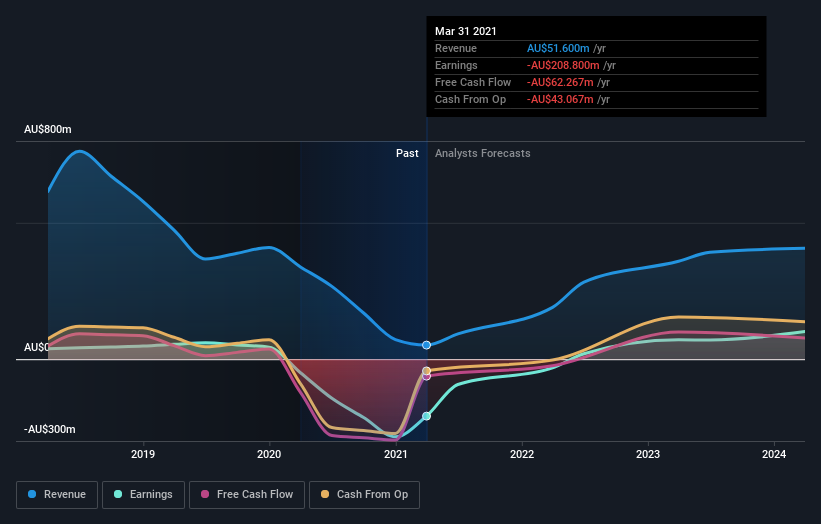
Webjet is a well known stock, with plenty of analyst coverage, suggesting some visibility into future growth. You can see what analysts are predicting for Webjet in this interactive graph of future profit estimates.
What about the Total Shareholder Return (TSR)?
We've already covered Webjet's share price action, but we should also mention its total shareholder return (TSR). Arguably the TSR is a more complete return calculation because it accounts for the value of dividends (as if they were reinvested), along with the hypothetical value of any discounted capital that have been offered to shareholders. Dividends have been really beneficial for Webjet shareholders, and that cash payout explains why its total shareholder loss of 48%, over the last 3 years, isn't as bad as the share price return.
A Different Perspective
It's good to see that Webjet has rewarded shareholders with a total shareholder return of 49% in the last twelve months. That certainly beats the loss of about 1.2% per year over the last half decade. We generally put more weight on the long term performance over the short term, but the recent improvement could hint at a (positive) inflection point within the business. I find it very interesting to look at share price over the long term as a proxy for business performance. But to truly gain insight, we need to consider other information, too. Case in point: We've spotted 1 warning sign for Webjet you should be aware of.
If you are like me, then you will not want to miss this free list of growing companies that insiders are buying.
Please note, the market returns quoted in this article reflect the market weighted average returns of stocks that currently trade on AU exchanges.
This article by Simply Wall St is general in nature. It does not constitute a recommendation to buy or sell any stock, and does not take account of your objectives, or your financial situation. We aim to bring you long-term focused analysis driven by fundamental data. Note that our analysis may not factor in the latest price-sensitive company announcements or qualitative material. Simply Wall St has no position in any stocks mentioned.
Have feedback on this article? Concerned about the content? Get in touch with us directly. Alternatively, email editorial-team (at) simplywallst.com.
